FREE: Start your trial today
Visualize your data! Request full access to our SDKs, demos and live-coding playgrounds.
The latest versions of KeyLines and ReGraph, our graph visualization SDKs, include two hotly-anticipated enhancements to keep your chart clear and insightful: we’ve brought curved link styles and sequential arrangement to open combos.
We’ve also made our sequential layout smoother and more adaptive, so it’s even better at handling dynamic data.
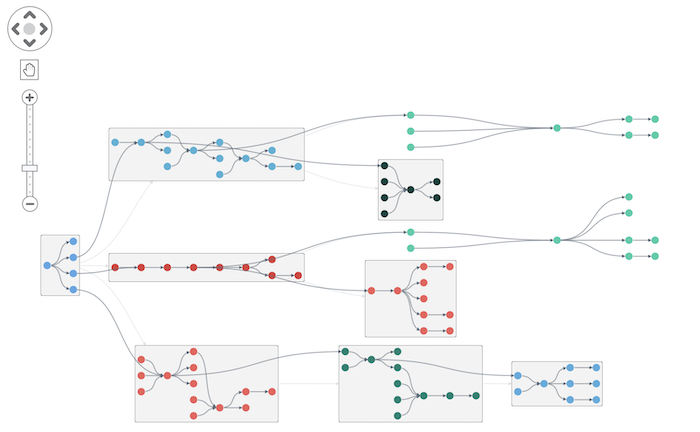
Our sequential layout is the most advanced way to explore tiered data. It automatically places nodes in the best positions and is easily adaptable to your needs. The new sequential arrangement unlocks all of these advantages for combos, letting you drill down into the sub-hierarchies within groups of nodes and links.
We’ve also introduced a new space-saving option for both sequential layout and arrangement in charts where the levels are unevenly weighted due to differently sized combos.

Dynamic data can be hard to follow. Our latest sequential layout makes it easy, with smooth and consistent changes to help users keep track of even the fastest-moving datasets.
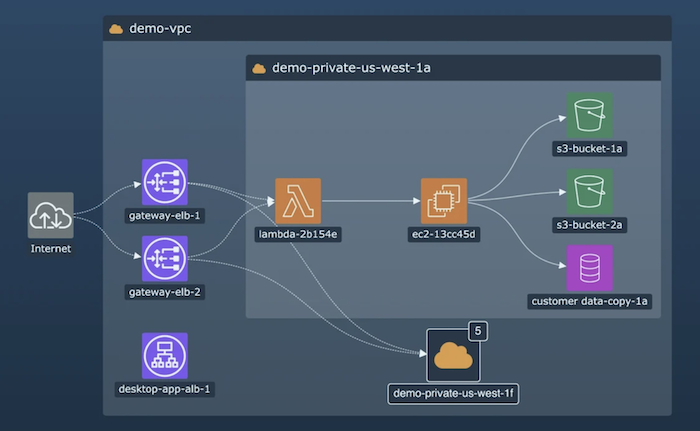
Curved links are a popular design feature for directional layouts. You can now combine them with our new sequential arrangement, creating a clean, stylish and user-friendly way to visualize flow.
We’ve introduced a new customization option for link paths, so that you can enhance your chart with curved links inside open combos.

If you’re already using our toolkits, you can download the latest versions right now from the KeyLines or ReGraph SDK sites. And if you’re not already on board but you’d like to try out these features for yourself, now’s the time to sign up for a free trial!