
Remember the WannaCry ransomware attack? Launched in May 2017, it was one of the most devastating and extensive cyber attacks in history, affecting over 200,000 computers across 150 countries. And as the criminals behind the attack demanded payment in bitcoin, it also turned the spotlight on cryptocurrency analysis.
In our WannaCry analysis, we explore the role data visualization tools play in detangling the cryptocurrency transactions involved in ransomware attacks. We dig deeper into the bitcoin ransoms paid by some victims and investigate how attackers managed to exchange their cryptocurrency for cash.
Why do hackers demand cryptocurrency?
The popularity of cryptocurrencies keeps growing, encouraged by greater accessibility and record prices. In 2021, over $15 trillion of trade took place on centralized and decentralized cryptocurrency exchanges, an increase of nearly 700% over 2020 trading volumes.
Predictably, it isn’t just legitimate investors getting to grips with bitcoin and other cryptocurrencies. Criminals choose it because it offers an anonymous, secure, low-cost way to transfer funds quickly. They then trade on the darknet, fund terrorism or – in this case – carry out ransomware and extortion campaigns.
Through cryptocurrency analysis, we start to recognize patterns of criminal behavior. Let’s find out how the WannaCry attackers operated.
How the WannaCry ransomware attack worked
WannaCry exploited a vulnerability in older Microsoft Windows operating systems. Once computers were infected with a ‘cryptoworm’, it encrypted files and displayed a message asking for bitcoin in exchange for decryption.
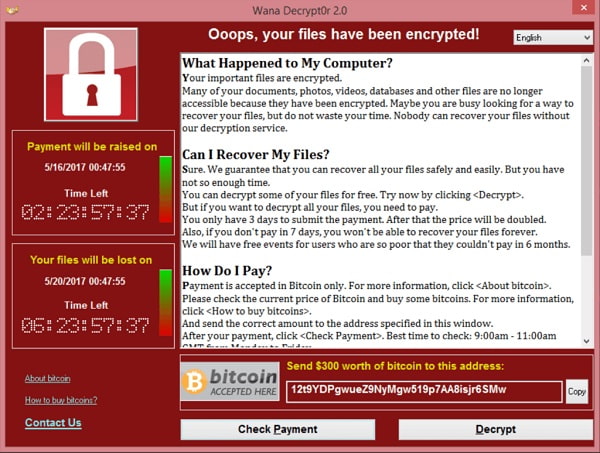
Here the attackers want the victim to send $300 worth of bitcoin to one address: 12t9YDPgwueZ9NyMgw519p7AA8isjr6SMw
[If you’re new to bitcoin, check out this short overview of bitcoin visualization.]
The prime suspect for the WannaCry attack is the North Korean-backed Lazarus Group, labeled a ‘state-sponsored hacking organization’ by the FBI. Their ultimate goal was to move their bitcoin to exchanges so they can cash it out for fiat currency.
How did they do that? Let’s use our toolkits to build a cryptocurrency analysis tool and find answers.
Visualizing the WannaCry analysis data
Our tool uses graph visualization to help us understand connections in the complex network of bitcoin transactions. Bringing the data to life in this way can reveal how many victims paid their attackers, and where the money went.
We’ve built it using the ReGraph SDK for React developers. The blockchain technology powering bitcoin means every transaction is visible. We accessed the data and then translated it into the JSON format ReGraph understands.
We also assigned risk scores based on data from the Bitcoin Abuse Database which shares reports of addresses linked to ransomware attacks.
The visual model is simple:
- Each node is a bitcoin address or a wallet containing multiple addresses
- Nodes are color-coded depending on their level of risk: red for high risk, orange for medium, blue for low
- Nodes are sized based on the outbound transaction amount – basically how much bitcoin the address sent
- Links represent transactions between addresses
- Links are sized based on the value of that transaction: the wider the link, the greater the value
Most WannaCry analysis starts by looking at the attacker’s address. As this address is already seen as high risk, it’s represented by the red node selected here:
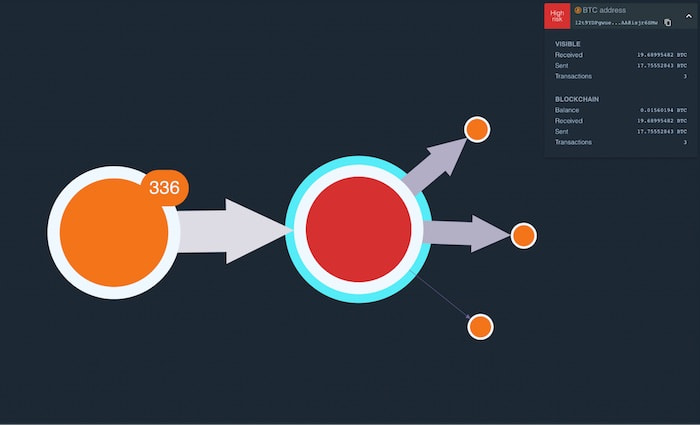
The orange node represents victims who sent bitcoin to the attacker’s address. Let’s explore this in more detail.
Payments made to attackers
We’ve customized the orange node with a useful glyph that tells us 336 payments were made.
To reduce clutter in the graph and make it easier to manage, we’ve grouped these transactions into one combined node, or combo. To see the individual addresses and transactions, we simply expand it.
Remember, we’ve sized nodes depending on the value of bitcoin each address sent. Larger nodes are concentrated in the center so it’s easier to focus first on those addresses that made larger payments. The nodes with icons represent wallets, which contain multiple addresses belonging to the same entity.
How to follow the money
The goal for these attackers is to convert their bitcoin into fiat currency – they have no interest in bitcoin’s long-term investment value.
A popular method for cashing out involves transferring bitcoin to a cryptocurrency exchange. This is a platform that facilitates trading, whether that be trading one cryptocurrency for another, or simply selling cryptocurrency for dollars.
But we know from previous cryptocurrency analysis that attackers rarely transfer funds directly into an exchange in one simple transaction. Instead, they transact through a series of intermediary addresses in the hope of obfuscating the trail for investigators.
The WannaCry attackers split the bitcoin into three transactions, represented by two thick links and one thin one. We can click on each link to reveal the value of each transaction.
Let’s follow the trail to see where the money goes next.

This time we see two relatively large transactions again, together with four smaller ones. Visualizing the data this way reveals a definite pattern, with the attackers intent on moving the majority of the bitcoin through intermediary addresses, while peeling off smaller amounts in an attempt to convolute the trail.
Let’s expand our investigation to 5 hops out. We’ll also change our node-sizing algorithm to show which addresses (nodes) received the largest amount of bitcoin. This will help us to easily identify when the attackers cashed out.
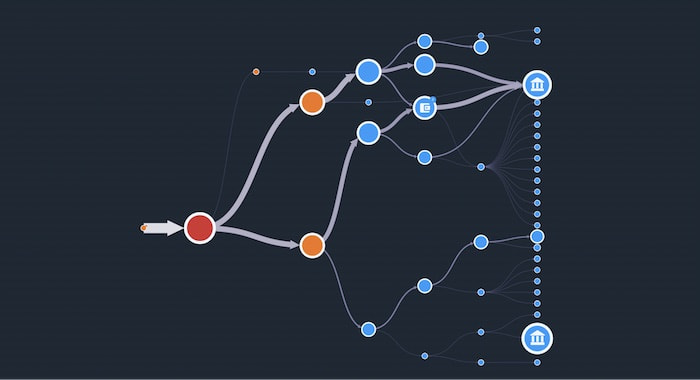
Bingo! We’ve found some exchanges!
To make them stand out, we’ve customized nodes that represent cryptocurrency exchanges using icons of buildings. We know these are exchanges because we’ve already carried out cryptocurrency analysis and discovered they’re responsible for very high trading volumes historically.
From the larger widths of the transactions feeding into it, we can clearly see that most of the currency has been funneled into the top exchange. Now lets take our WannaCry analysis one stage further.
Extending our WannaCry analysis with timeline analysis
Graph visualization is invaluable for providing insight into relationships and flows in a network, but what if we wanted to answer time-specific questions such as:
-
- Were all of the ransomware payments made to the attackers at around the same time?
- Over what time period did this entire transaction trail take place?
Our KronoGraph timeline analysis tool helps to reveal how events unfold and how they’re linked.
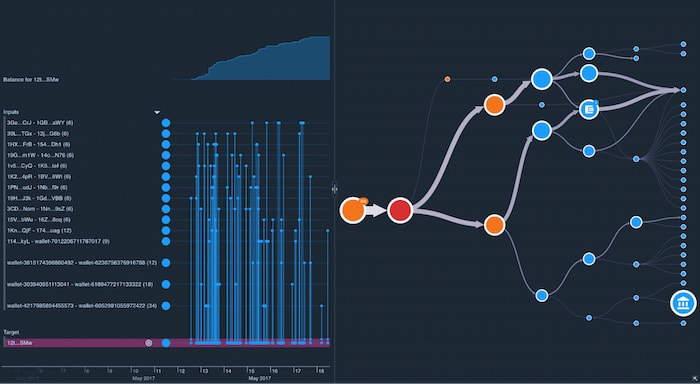
We’ve added a timeline to our network chart, showing when the series of transactions took place. With the WannaCry ransomware address selected, the timeline reveals that the majority of ransomware payments made to this address occurred between May 12th and 18th.
Above the timeline in the top left corner is a time series chart showing the value of the attacker’s account over the same time period. Notice that it was zero before the ransomware payments were made, and as transactions came in, the attackers waited while the balance steadily increased.
Our WannaCry analysis clearly shows that it was 10 weeks before the attackers started moving bitcoin out of this initial address. Did they think this would give them a better chance of cashing out unnoticed? Their ransomware addresses had been reported already, so law enforcement agencies were watching carefully.
But at the start of August, the series of transactions we see in the network chart above was initiated. Over the following 24 hours, the bitcoin was transferred to the exchange.
Most exchanges are required by law to comply with Know Your Customer (KYC) regulations. This means that anyone who wants to use the exchange to trade cryptocurrency must provide identifying information for the purpose of verification. The Lazarus group used stolen identities to get around this, giving analysts another series of criminal activities to investigate.
Combined with the forensic evidence revealed in our graph and timeline visualizations, investigators can subpoena cryptocurrency exchanges to uncover the people behind the alphanumeric address strings. Those that fail to follow KYC regulations face a range of punishments, or in the case of Bitcoin exchange BTC-e, get shut down.
Explore cryptocurrency and reveal insight
This WannaCry analysis demonstrates hows data visualization toolkits power applications that reveal insights. The complexities of cryptocurrency transactions are easier to understand when they’re visualized. Whether you want to ‘follow the money’ or identify criminal behavior patterns, our interactive toolkits can help.
Share:
