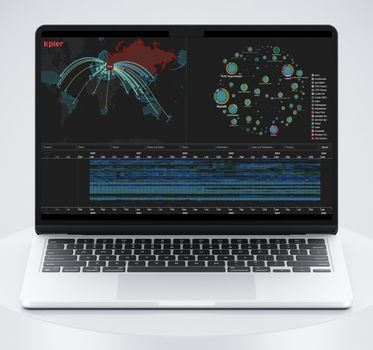
How sanctions reshaped – but didn’t reduce – Russian oil trade
Jan Girman Product Manager
24th February, 2026 | 13 min read
We worked with Kpler, the leading data provider in global trade intelligence, using our visualization SDKs to turn...
Jan Girman Product Manager
24th February, 2026 | 13 min read
We worked with Kpler, the leading data provider in global trade intelligence, using our visualization SDKs to turn...
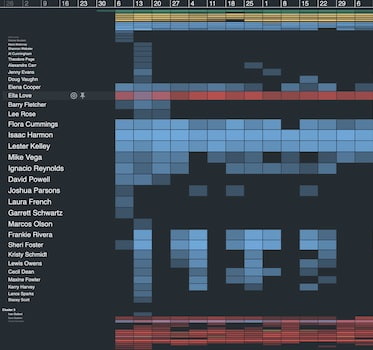
Jan Girman Product Manager
5th August, 2025 | 10 min read
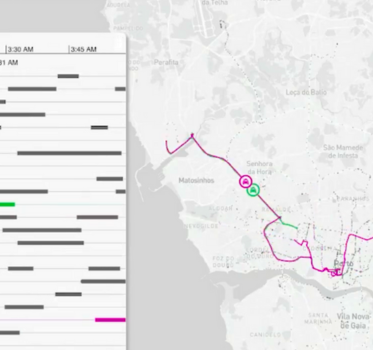
Pattern-of-life analysis reveals habits and behaviors in complex data. See how timeline and geospatial...

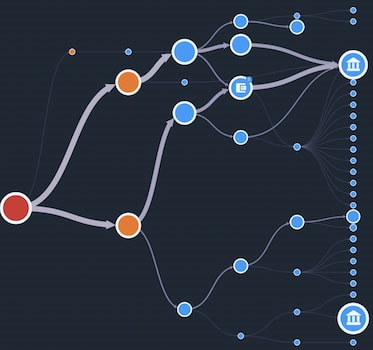
Courtney Collins Product Manager
22nd October, 2024 | 9 min read
At every stage of an investigation workflow, the analysts need to understand the underlying story – or...
Dan Williams Chief Product Officer
6th August, 2024 | 8 min read
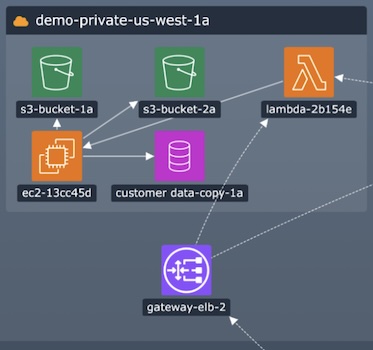
We look at six key areas of rapid change, and how successful organizations use link analysis techniques to keep...
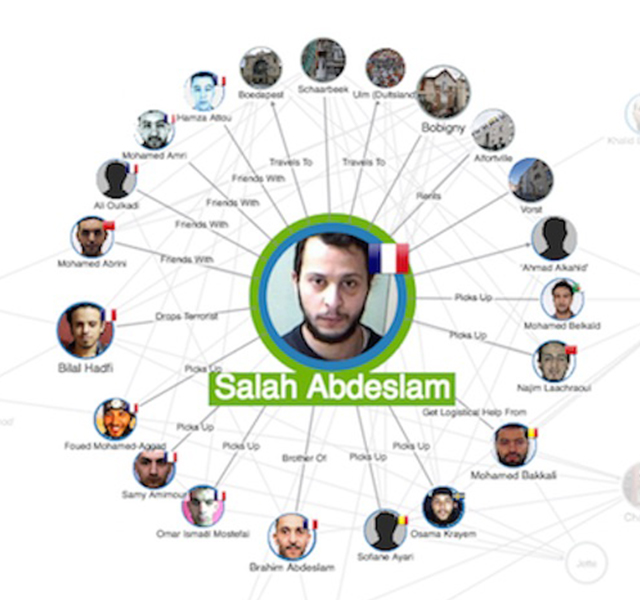
Bonney O'Hanlon Product Manager
23rd July, 2024 | 7 min read
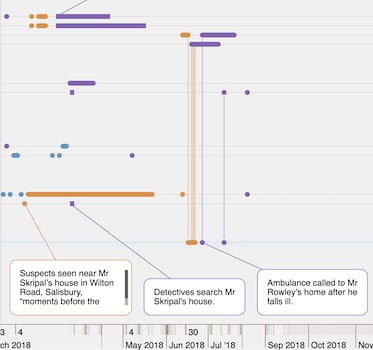
We create a crime data visualization to analyze the people, places and events involved in a real UK Counter...
Andrew Disney Marketing Director
12th May, 2024 | 11 min read
We explore the top real-world data visualization use cases, starting with law enforcement and fraud...
Catherine Kearns Content Strategist & Team Lead
11th October, 2022 | 7 min read
This post shows how unique navigation features in KronoGraph, our time-based visual analytics SDK, help analysts...
Matt Latham Product Manager
4th May, 2022 | 8 min read
Remember the WannaCry ransomware attack? Launched in May 2017, it was one of the most devastating and extensive...
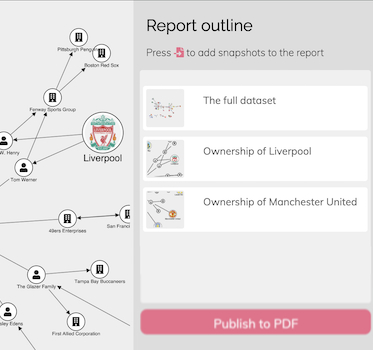
Dan Williams Chief Product Officer
1st March, 2022 | 9 min read
We use our graph visualization toolkits to publish a PDF report based on multiple snapshots of interactive graph...
Registered in England and Wales with Company Number 07625370 | VAT Number 113 1740 61
6-8 Hills Road, Cambridge, CB2 1JP. All material © Cambridge Intelligence .
Privacy Policy | Security Framework
