
In a recent blog post, we explored the role of interactive timeline tools in a typical police investigation. We saw how KronoGraph unpicks big and complex call data records (CDR) and communications metadata, revealing specific clues that drive an investigation forward.
CDR analysis rarely gives the full picture, though. To build a convincing case, investigators need to bring relevant information together from all available sources, linking it into a complete and compelling story that stands up in court.
That’s no mean feat. A typical investigation could involve data from dozens of different sources: witness reports, central police database records, internal record management systems (RMS), warrant databases, gang intelligence databases, internet service provider (ISP) data, body cam footage, to name a few.
Luckily, it’s another great use case for interactive timeline tools, especially combined with link analysis. Let’s take a look.
Combining interactive timeline tools with link analysis
This example shows a representation of People, Object, Location, and Events data. The ‘POLE’ model is widely used in police investigations and gives a structured method to categorize, store, and connect information relating to an incident.
We’ve combined a geographic link analysis chart with a KronoGraph-built interactive timeline tool, at first just plotting information from eye witness reports.
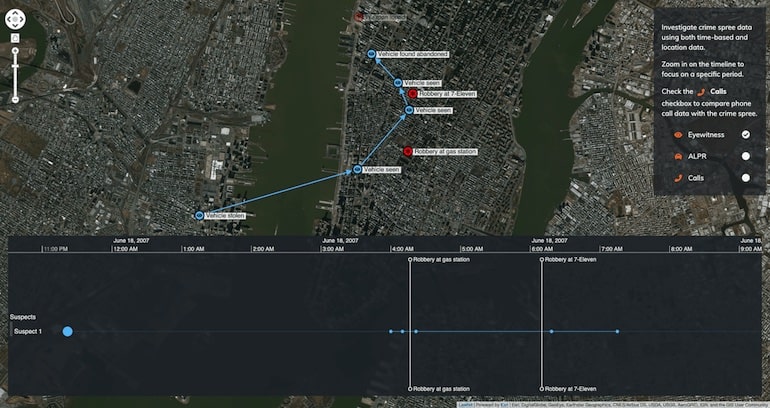
A vehicle is stolen in New Jersey then spotted again in Manhattan, close to two reported robberies. The vehicle is then abandoned northwest of the second robbery, and a weapon found nearby. The interactive timeline tool shows this all took place between 4am and 10am on 18 June.
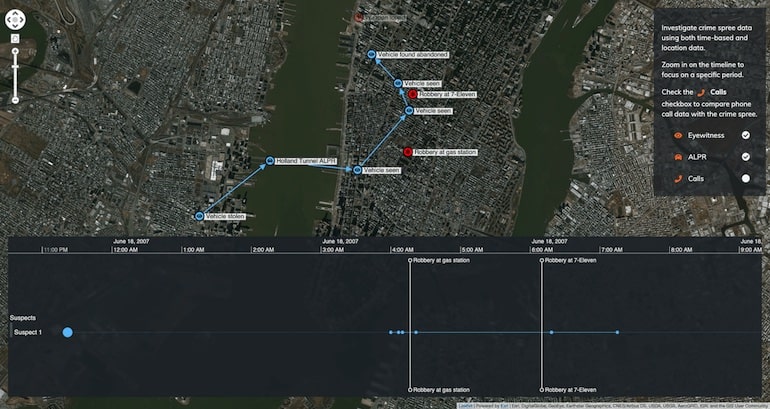
In both of our visualizations, we can layer-up datasets – adding more information and context to help reveal the bigger picture. Let’s start with some Automated License Plate Recognition (ALPR) data.
Next, let’s add some cell phone data to see if our suspect spoke to anybody during the robberies. This shows four phone calls made by the suspect to a possible accomplice around 6am – just after the robbery at 7-Eleven.
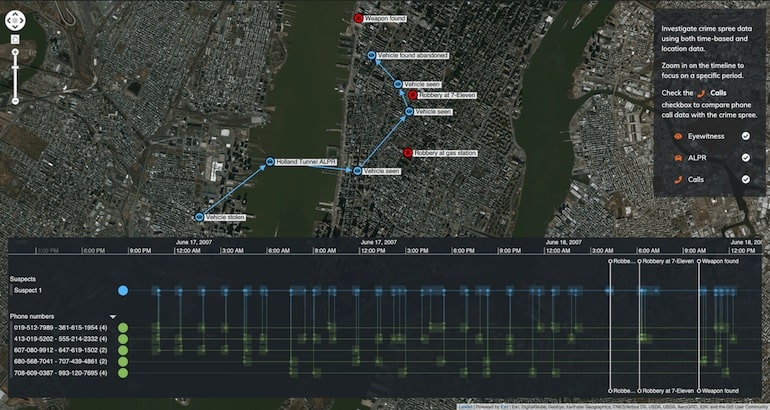
There’s another call to the possible accomplice at around 10am, just after the weapon was found.
By interacting with this visualization, layering-up data from different sources, investigators can answer ‘who, what, where and when’ questions, simplifying complex scenarios to reveal persons of interest and lines of inquiry.
It also makes it easier to identify the most relevant and admissible information to submit in a case, helping reach the overall goal of conviction.
Timelines that drive investigations
We’ve seen how timeline visualization reveals sequences and patterns in complex connected events.
As a standalone interactive timeline tool, or combined with one of our link analysis toolkits, it gives law enforcement and intelligence teams the vital insight they need to solve crimes, make prosecutions and keep everyone safe.
The examples we’ve shown so far only scratch the surface of what’s possible. If you want to see how KronoGraph handles your own data, request a free trial.
FREE: Start your KronoGraph trial today
Request full access to our KronoGraph SDK, demos and live-coding playground
Share:
