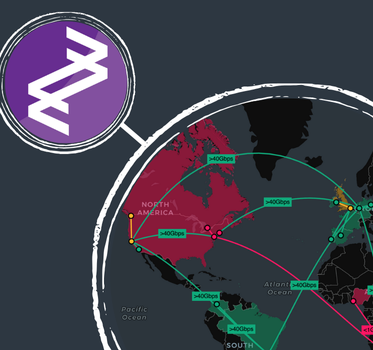
Introducing MapWeave: geospatial visualization that reveals every connection
Bonney O'Hanlon Product Manager
12th March, 2025 | 5 min read
Say goodbye to cluttered maps, disjointed geospatial visualization and analysis that only tells you half the...
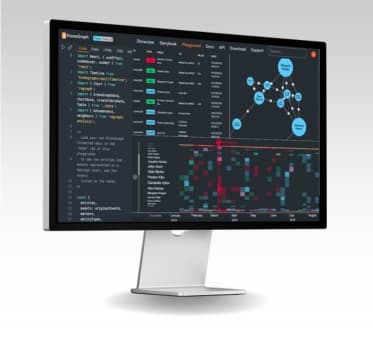
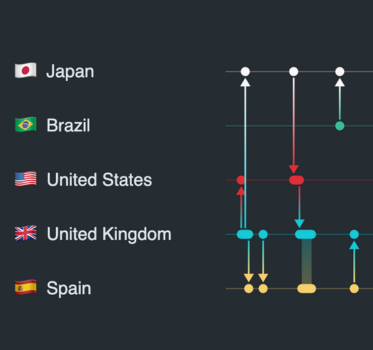
Product update: inspiration for your data visualization dashboard
Bonney O'Hanlon Product Manager
5th September, 2024 | 2 min read
The latest version of KronoGraph, our timeline analytics toolkit, features something unique. For the first time,...
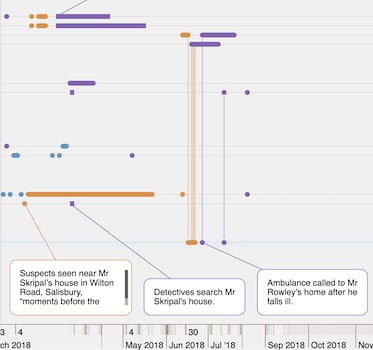
Crime data visualization: analyzing the Salisbury poisonings
Bonney O'Hanlon Product Manager
23rd July, 2024 | 7 min read
We create a crime data visualization to analyze the people, places and events involved in a real UK Counter...
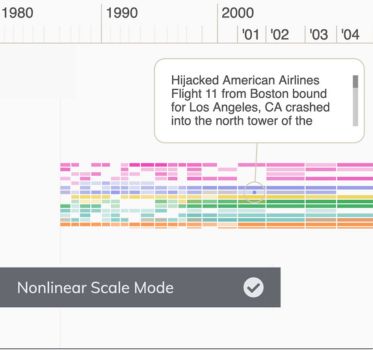
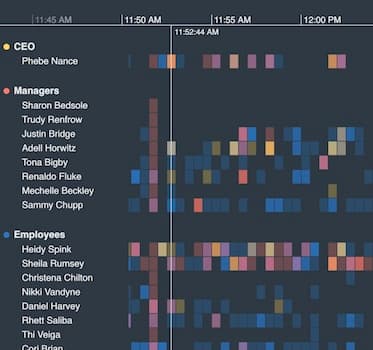
Navigate and analyze complex timelines with smarter event spacing
Bonney O'Hanlon Product Manager
16th July, 2024 | 4 min read
We’ve just released KronoGraph 3.0 – a new major version of our timeline analytics toolkit – with a...
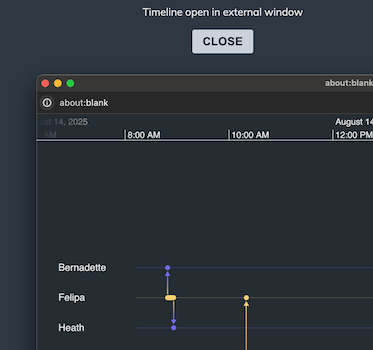
Product update: open KronoGraph in a new window
Bonney O'Hanlon Product Manager
16th April, 2024 | 2 min read
When analysts and investigators use apps built with our toolkits, we aim to give them the best user experience. In...
Product update: reveal event times at any zoom level
Bonney O'Hanlon Product Manager
7th March, 2024 | 2 min read
The latest version of KronoGraph, our timeline visualization toolkit, makes it easier to reveal detailed timings...
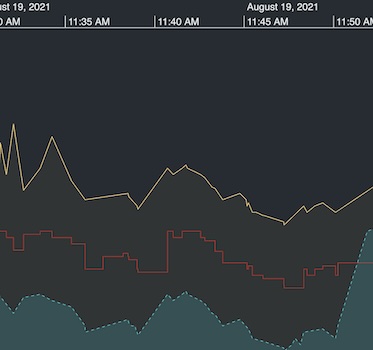
Product update: stack & style your time series charts
Bonney O'Hanlon Product Manager
19th December, 2023 | 2 min read
The latest version of KronoGraph, our timeline analysis SDK, sees time series charts move out of beta development...
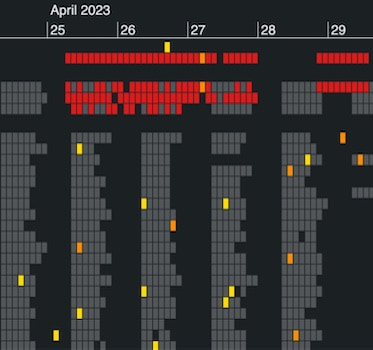
Product update: tell your data story with custom color heatmaps
Bonney O'Hanlon Product Manager
17th October, 2023 | 2 min read
The latest version of KronoGraph, our timeline visualization SDK, includes more ways to customize heatmap cells...
Product update: manage your screen space & try new pings
Bonney O'Hanlon Product Manager
22nd August, 2023 | 3 min read
The latest updates to KronoGraph, our timeline visualization toolkit, demonstrate how to emphasize the most...
