FREE: KronoGraph white paper
Our essential guide to building powerful and intuitive timeline visualization applications.
The latest version of KronoGraph, our timeline analysis SDK, sees time series charts move out of beta development to become a fully-fledged feature of the toolkit. We’ve improved the charts in the process, so it’s now easier for users to customize and analyze their time series charts, as well as compare series data without taking up extra screen space.
KronoGraph users will find significant improvements to performance when loading data to the timeline – it’s now more than 37% faster. There’s also a smoother experience when panning and zooming animations.
Optimize your timeline space and analyze multiple data sources with a new option to stack time series charts on top of one another. There’s still the option to view time series charts separately, but stacking them makes it easier to spot patterns and anomalies.
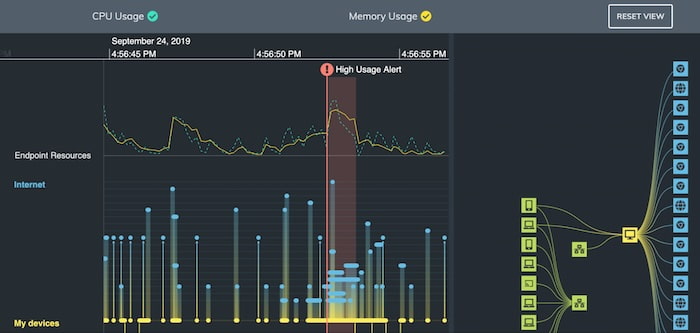
See the updated Network Traffic Alerts demo on the KronoGraph SDK for a stacked example. We’ve also changed the Time Series Charts Tooltips story, so you can explore how tooltips behave with the new stacking option.
Our essential guide to building powerful and intuitive timeline visualization applications.
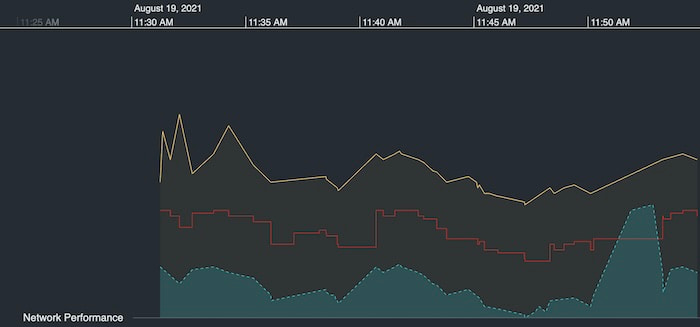
You can now customize time series charts to make them easier to distinguish, and match the style of your app. Define both the color of the lines and the line style (solid or dashed), and adjust the time series chart shading or remove it completely.
To see different line and fill styles for multiple time series charts, head to the KronoGraph SDK’s updated Time Series Charts story.
These time series chart improvements are just the latest in a long line of powerful features and enhancements that make our timeline visualization SDK an essential part of every serious analysis tool. If you’re not a KronoGraph user already, start a free trial today.
Request full access to our KronoGraph SDK, demos and live-coding playground
Registered in England and Wales with Company Number 07625370 | VAT Number 113 1740 61
6-8 Hills Road, Cambridge, CB2 1JP. All material © Cambridge Intelligence .
Privacy Policy | Security Framework


