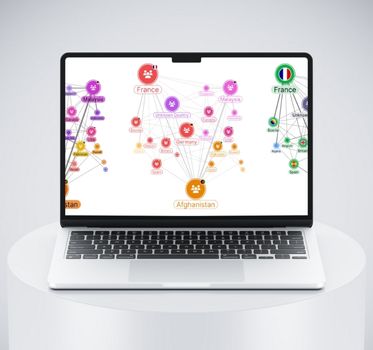
Graph visualization UX: Designing intuitive data experiences
Zach Mason Product Designer
24th June, 2025 | 18 min read
We share expert graph visualization UX principles that make the difference between user frustration and...
Zach Mason Product Designer
24th June, 2025 | 18 min read
We share expert graph visualization UX principles that make the difference between user frustration and...
Bonney O'Hanlon Product Manager
22nd August, 2023 | 3 min read
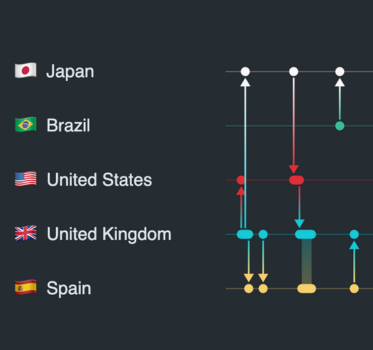
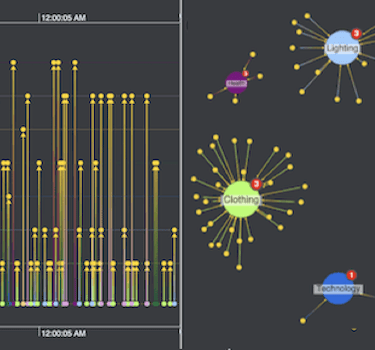
The latest updates to KronoGraph, our timeline visualization toolkit, demonstrate how to emphasize the most...
Bonney O'Hanlon Product Manager
18th May, 2023 | 4 min read
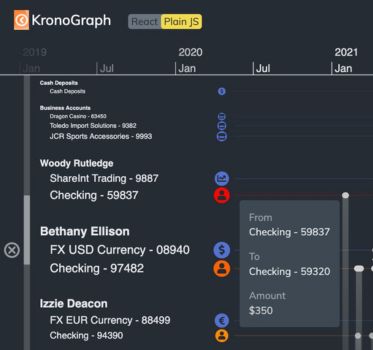
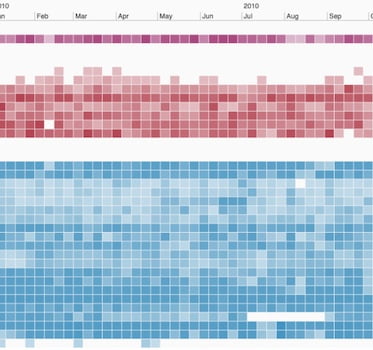
KronoGraph 2.4 introduces duration markers and enhanced styling options to make the important characteristics of...
Bonney O'Hanlon Product Manager
31st January, 2023 | 7 min read
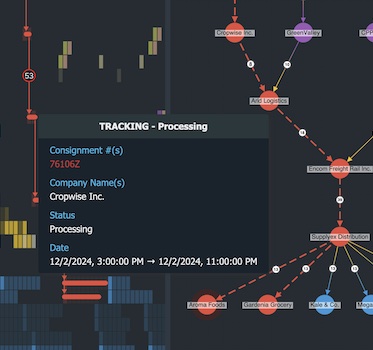
Over recent years we’ve seen more and more businesses digitizing their supply chain processes. Our latest demo...
Dan Williams Chief Product Officer
16th August, 2022 | 8 min read
Want to know how to do timeline data modeling? We explore best practices with real-world examples of the best...
Khadeja Sajjad Software Developer
17th August, 2021 | 10 min read
In this post, I’ll aim to spot fake Amazon reviews using the powerful graph and timeline data visualization...
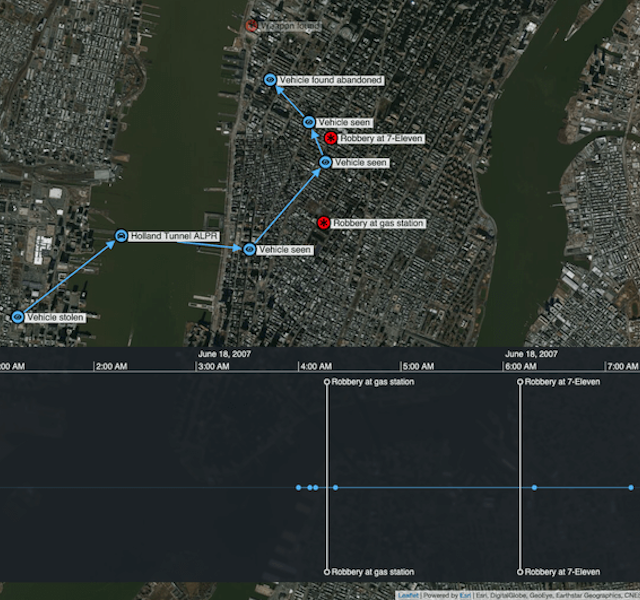
Andrew Disney Marketing Director
23rd February, 2021 | 4 min read
To build a criminal case, investigators collate information from all sources, revealing an accurate and compelling...
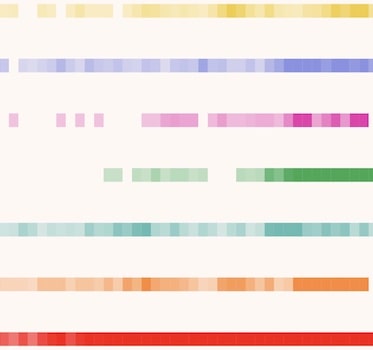
Andrew Disney Marketing Director
24th November, 2020 | 10 min read
We explore basic color theory, and how carefully-chosen colors can help make your visualizations look good, and...
Andrew Disney Marketing Director
29th September, 2020 | 6 min read
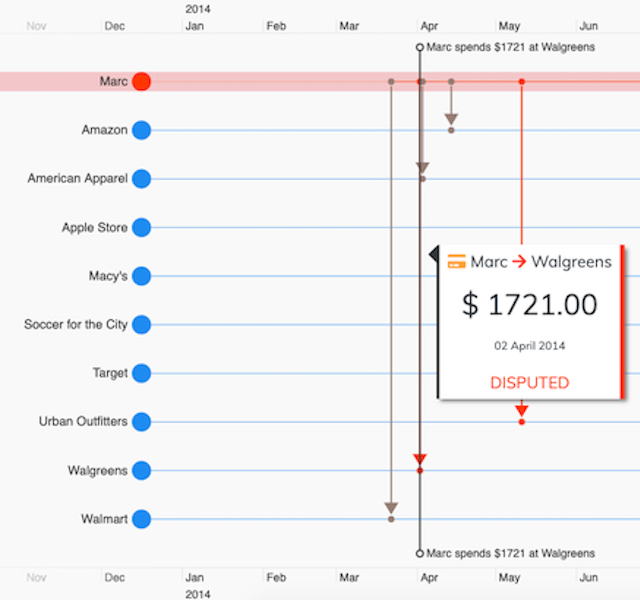
Building timeline visualization tools for fraud investigations, using the KronoGraph timeline visualization...
Registered in England and Wales with Company Number 07625370 | VAT Number 113 1740 61
6-8 Hills Road, Cambridge, CB2 1JP. All material © Cambridge Intelligence .
Privacy Policy | Security Framework
