FREE: Start your KronoGraph trial today
Request full access to our KronoGraph SDK, demos and live-coding playground
Complex timeline data is a big challenge for analysts, especially if it covers a long time frame and thousands of events. The latest version of our timeline visualization toolkit, available now, makes it easier than ever.
KronoGraph 2.4 introduces markers to highlight timeline durations of interest, not just points in time. And you can now use enhanced styling options to make the important characteristics of markers, events and entities stand out.
We’ve also introduced higher resolution timing, for investigations where every nanosecond counts.
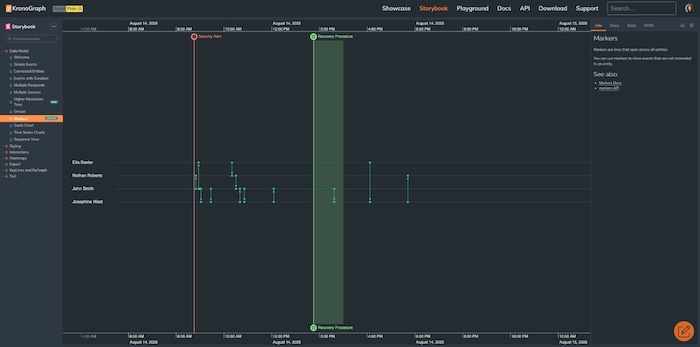
Markers are a way to annotate specific moments in time. They add important context to your timeline by marking significant activities which aren’t part of your dataset, such as a security alert or profit announcement.
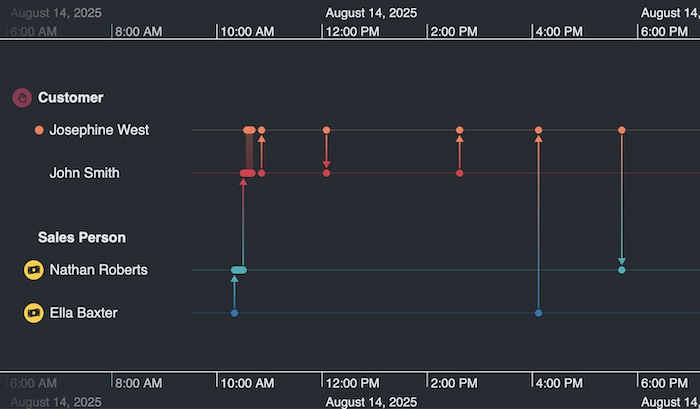
With the latest update, markers can now highlight a period in time, not just a single point. You can customize the shading of these ‘duration markers’ to suit your color scheme, and add optional font icons and labels at either end of the marker to show the type of event they represent.
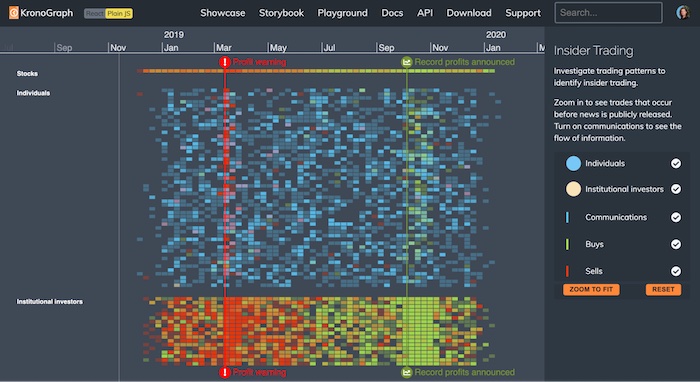
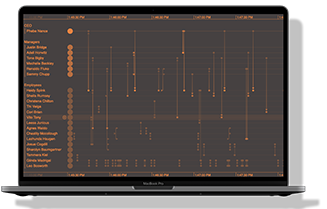
This heatmap represents thousands of transactions and communications in an insider trading investigation. Even at the highest level, customized markers cut through the noise to identify key points in time that are crucial to the investigation. Simple font icons and labels, color coded to match the associated transactions, make a complicated story easy to understand at a glance:
When a colored dot just isn’t enough, you need your glyphs to be customizable. Custom colors and icons add meaning to your labels and highlight different entities, making your timelines easier to understand. A well-designed visualization doesn’t rely on words to tell a story – here are some examples of how clever customization can do a lot of work for analysts and investigators.
This timeline and graph visualization of a money flow investigation uses color-coded glyphs and themed font icons that make it easy to identify currencies, account holders and company types at a glance. You can choose corresponding colors and icons for your graph and timeline, to create visual links:
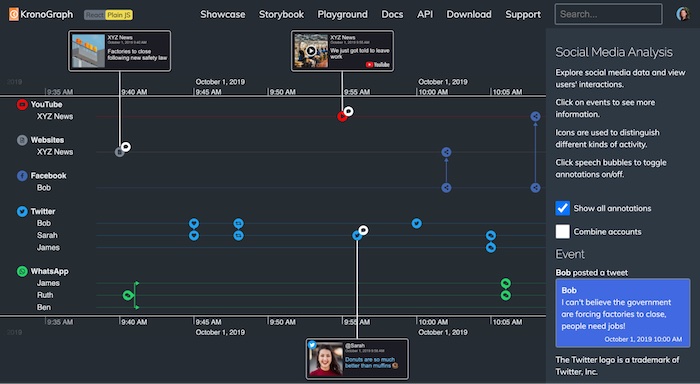
And this social media analysis demo uses glyphs to mark out entities on the timeline as accounts from specific social media platforms, or events such as tweets, shares and messages, to help analysts and investigators quickly identify specific events or types of activity. This demo also features media-rich annotations, another great example of how creative you can get with KronoGraph:
JavaScript doesn’t support sub-millisecond numbers, but we haven’t let that stop us making life easier for customers who have told us they need nanosecond timing in their life. From IT infrastructure managers pinning down critical errors to Bitcoin analysts combing through complex transaction events, KronoGraph now supports the higher resolution time they need, bringing nanosecond precision to their analysis and reports.
We’ll keep working to give you as much control as possible over your styling and customization, and finding new ways to help you explore your data. If you’re not already bringing a time dimension into your visualizations, give it a try – you won’t look back! Sign up for a free trial today:
Request full access to our KronoGraph SDK, demos and live-coding playground
Registered in England and Wales with Company Number 07625370 | VAT Number 113 1740 61
6-8 Hills Road, Cambridge, CB2 1JP. All material © Cambridge Intelligence .
Privacy Policy | Security Framework


