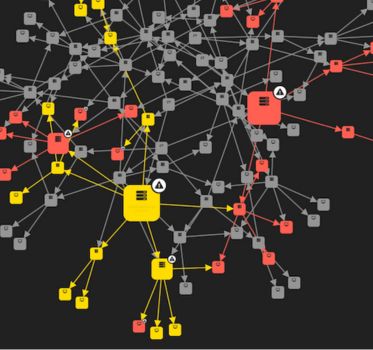
Stop making your users read: Why font icons are the key to better graph UX/UI
Courtney Collins Product Manager
12th January, 2026 | 5 min read
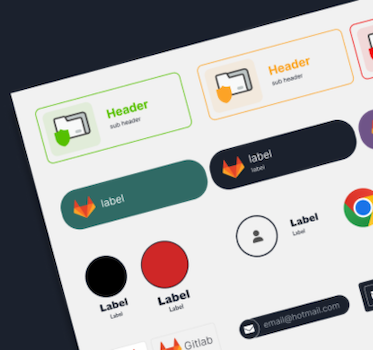
Font icons give graph viz users instant, universal cues: no translation needed, no mental...
Courtney Collins Product Manager
12th January, 2026 | 5 min read
Font icons give graph viz users instant, universal cues: no translation needed, no mental...
Ivan Krushkov Commercial Development Lead
16th December, 2025 | 12 min read
In this Tailwind CSS tutorial, we’ll show you how to customize your ReGraph app and achieve the designs you want...
Ryan Shimmon Commercial Software Developer
18th November, 2025 | 8 min read
Use the Elastic UI framework (EUI) to build an interactive graph visualization app that looks good and is ready to...

Zach Mason Product Designer
21st October, 2025 | 9 min read
This guide shares practical tips for building graph visualization tools that work for as many people as possible....
Zach Mason Product Designer
24th June, 2025 | 18 min read
We share expert graph visualization UX principles that make the difference between user frustration and...
Clare Haynes Product Designer
4th February, 2025 | 3 min read
Good user experience (UX) design is the foundation of a successful data visualization experience. It lets users...
Dan Williams Chief Product Officer
15th February, 2024 | 8 min read
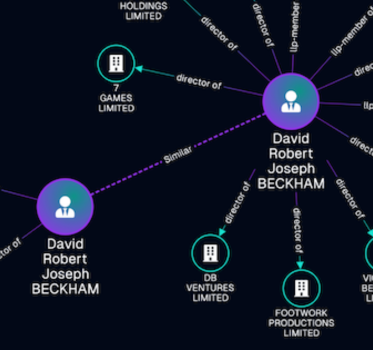
Find out how to use data visualization for compliance, putting analysts in control of their due diligence...
Ivan Krushkov Commercial Development Lead
9th August, 2023 | 8 min read
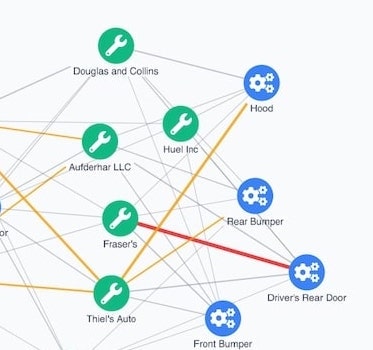
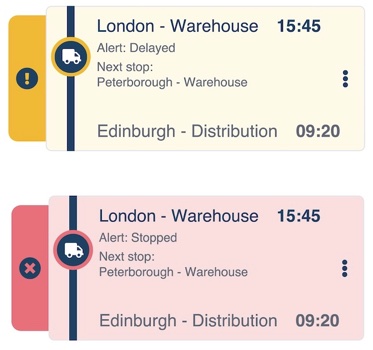
In this post, I show how easy it is to design a visual supply chain that’s customized to your users’ needs,...
Kevin Naughten Senior Product Manager
2nd December, 2022 | 10 min read
Bring the perfect graph visualization design to life: our KeyLines and ReGraph SDKs offer almost infinite...
Registered in England and Wales with Company Number 07625370 | VAT Number 113 1740 61
6-8 Hills Road, Cambridge, CB2 1JP. All material © Cambridge Intelligence .
Privacy Policy | Security Framework
