Building an infrastructure network visualization with KronoGraph and MapWeave
Jan Girman Product Manager
12th September, 2025 | 11 min read
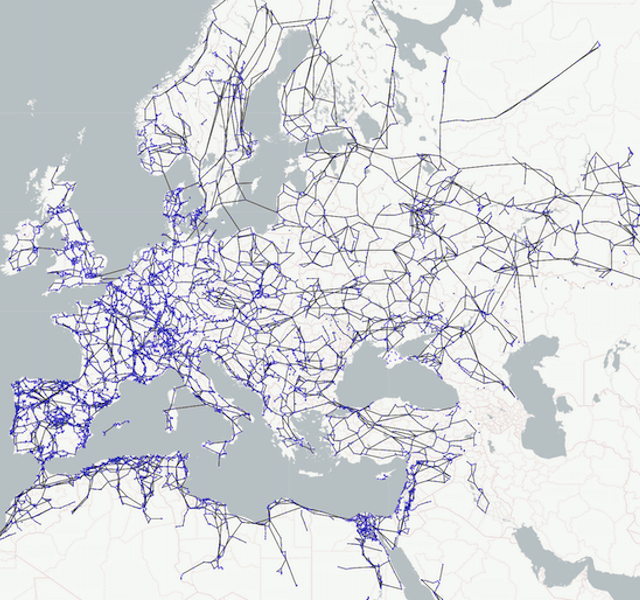
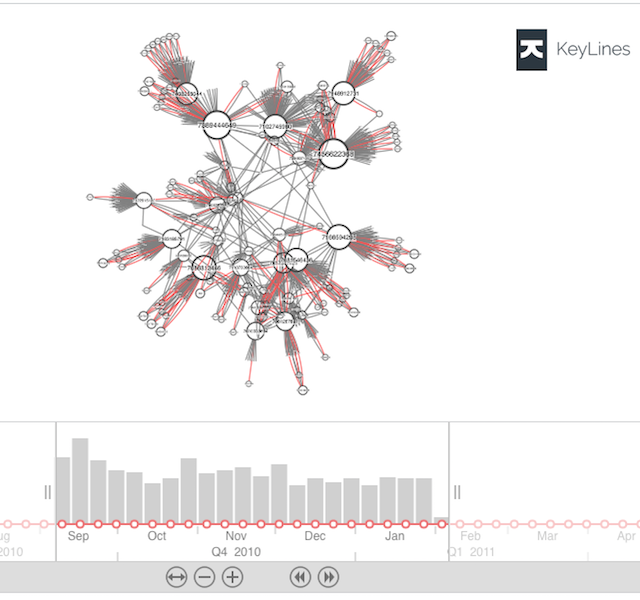
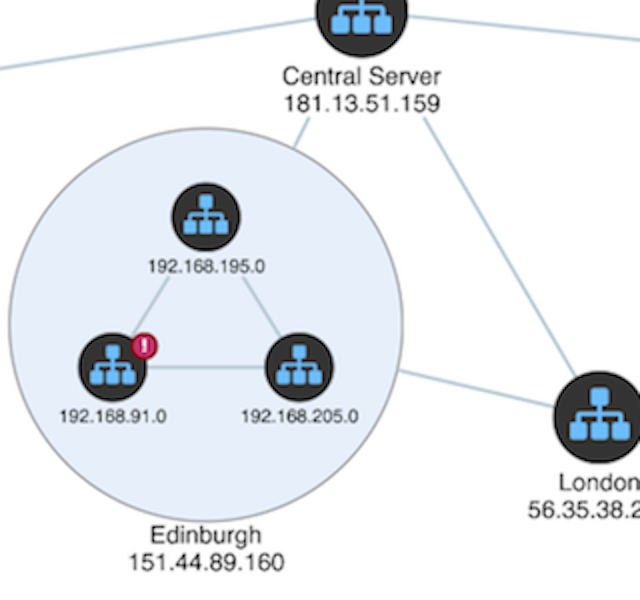
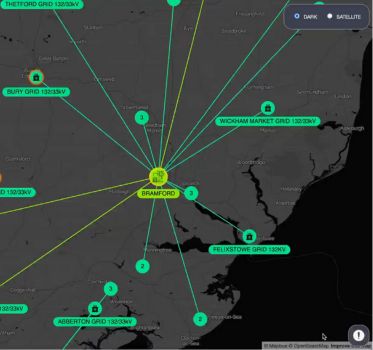
This technical guide to infrastructure network visualization covers timeline and geospatial features, scaling to...