FREE: Start your ReGraph trial today
Visualize your data! Request full access to our ReGraph SDK, demos and live-coding playground.
In this blog you’ll see how Synternet (formerly Syntropy), a global team of web3 pioneers, use our network visualization toolkits to create a live journey planner for the internet, helping enterprises choose the fastest and safest routes for their data.
Chaos reigns on the internet. It’s just something we’ve learned to live with – flaky connections, unpredictable latency, lost data. It’s frustrating and risky for personal users, and there’s even more at stake for enterprises, most of whom rely on their own internal networks as well as the public internet.

For their businesses to function, they have no option but to pay the gatekeepers of the information superhighways: providers who control the routes from A to B, using their own routing protocols and autonomous systems.
The problem with this is that there’s no incentive for network providers to wish you a safe or speedy journey. They treat your data packets like hot potatoes – getting them out of their network as soon as possible. Today, the Chrome T-rex and the sad Firefox face might be as universally recognized as the Mona Lisa.
The internet was built on shaky foundations. It came to life in the 80s, when it was just a bunch of university departments sending data to each other. Insecure systems, like the well-thumbed road atlas that is the Border Gateway Protocol, mean that these foundations are starting to crack. Companies often invest a lot of time and money in their own layers of tech, to cope with the obstacles they face on the public internet.
Synternet has built a collection of technologies to help everyone rise above these problems. They’ve introduced a new layer to the current internet framework, one that finds the fastest, safest and greenest routes for data across the internet. And they’re using our toolkits for the all-important visualization of those routes.
“ReGraph was the best visualization solution we found to offer our customers the responsive, interactive charts they need to understand complex networks and take their journey into their own hands.” – Jonas Simanavicius, Co-Founder and Chief Technology Officer at Synternet
Synternet want to let users choose the best routes for their connections, rather than letting ISPs choose for them. This is all made possible via Synternet Stack. It’s a collection of tools and libraries based on technologies including blockchain, encryption, and route optimization, and an economic model that incentivizes network providers to play fair, helping them offer attractive options to their users.
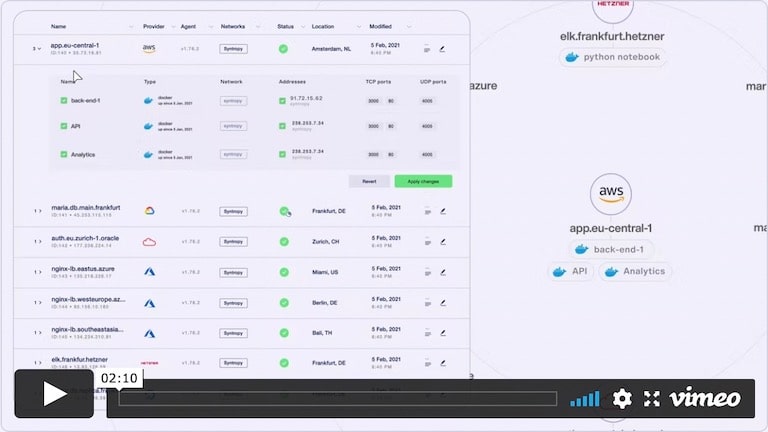
Synternet installs an agent on each participating server, and maps the available routes between two points. The options can be tailored to the user’s journey, based on the nature and complexity of what they need to do. An interactive dashboard, powered by our ReGraph toolkit, displays them in a graph view.
Synternet can support almost any device or application that connects to the Internet. From network analysts who need to stay ahead of connectivity issues to developers who need to deploy and manage applications, all of Synternet’s customers have a need in common: getting safe passage for their data in a way that’s accessible, reliable and fully risk assessed. And a key part of showing them their options is to help them visualize the networks they need to navigate.
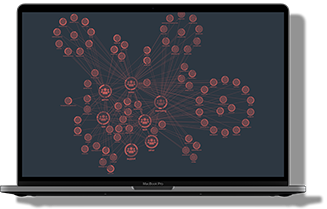
Graph visualization is a uniquely intuitive way to understand network connections. It helps users who constantly find themselves choked up in traffic or besieged by connectivity problems to visualize alternative off-grid routes they didn’t realize were open to them.
When you use Synternet Stack, the first step is to identify your destination. Synternet’s algorithms then monitor the internet for inefficiencies and ‘choke points’, identifying the three best alternative routes for you. And because the internet is a messy and unpredictable place, once you’ve started your journey they will make sure you avoid costly downtime by using their smart-routing DARP technology to dynamically re-route if there’s an unexpected obstacle.
The ReGraph visualization on the Synternet Stack dashboard shows the health of the network you’ll be traveling in graph or map view, with links representing the status of those connections. These types of visualization make it easy for you to get an overview of system performance and uncover vulnerabilities, bottlenecks and faults as they come and go, proactively responding to any connectivity issues or threats.
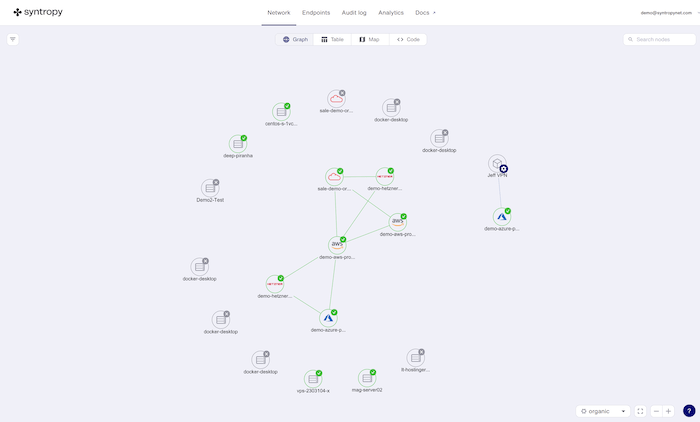
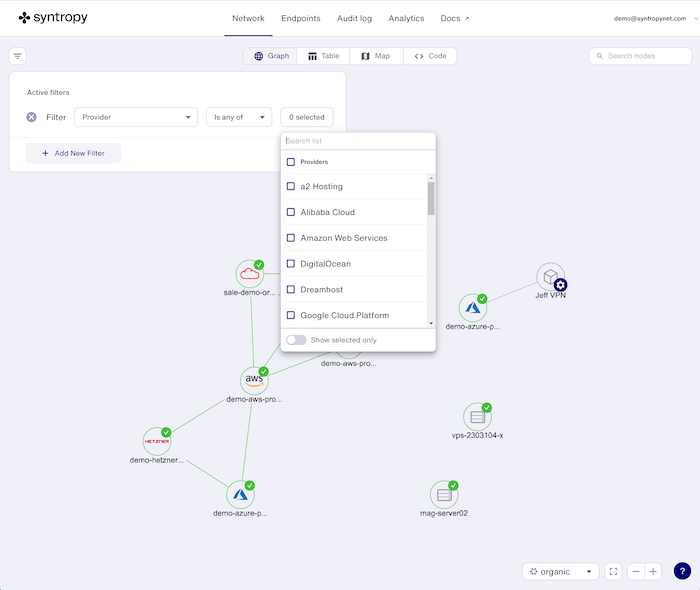
Each node represents an endpoint provider, and the glyphs show the endpoint’s status. The color coding and custom icons make it easy to pick out different types of connection. You can customize your journey plan by applying filters, which allow Synternet’s tech to calculate the most efficient routes based on the criteria you choose.
The chart isn’t just there to help users see the big picture and view connections. Our graph visualizations are interactive, which means that you can explore options at your own pace, expanding connections and details on demand while also updating your data – all within the visualization component.
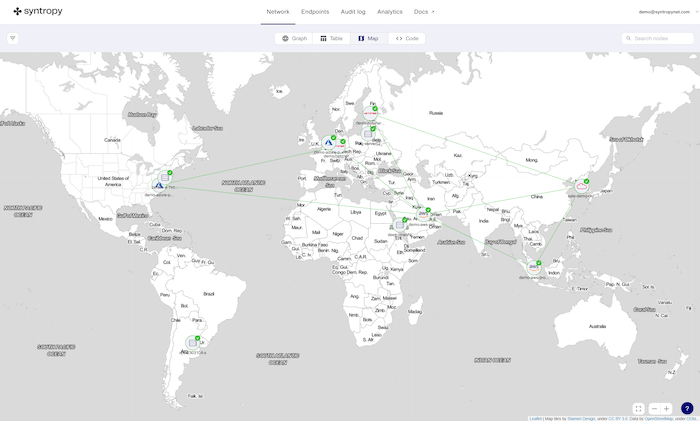
The map view makes it easy to see the network’s real life locations and quickly understand whether a particular area is experiencing connection issues:
The charts also act as a navigation UI. Users can click on any link to be taken to an analytics view that shows historic data for that specific connection. This info allows them to assess the connectivity patterns and weigh up the risks of taking that route:
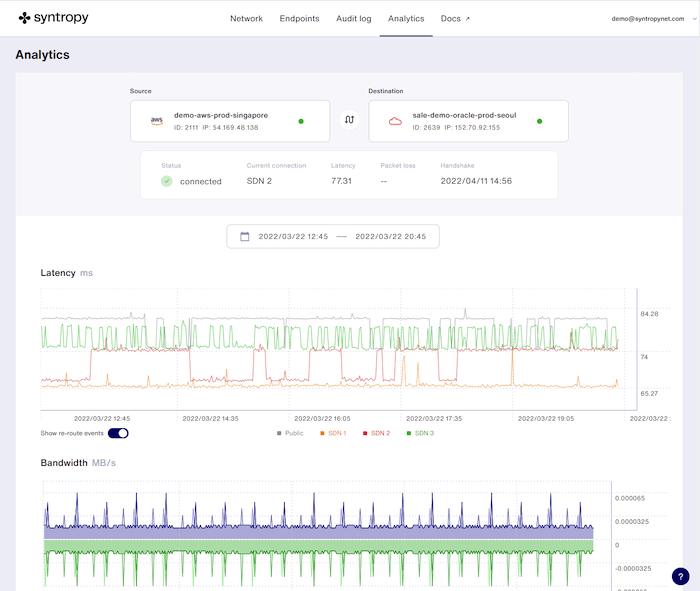
Here we’re seeing the bandwidth and latency of different routes. You can monitor the status and performance of every connection on the network. Grey shows the default option – using the public internet. The other colors represent three better routes suggested by Synternet’s algorithm. A small latency difference of a few milliseconds can have a massive impact on application performance, especially if your users are going to be sending high volumes of data on repeat or convoluted journeys.
In the scenario of a bank carrying out high-velocity trades, for example, the algorithmic trading relies on realtime communications between financial centers, so a few milliseconds can make a big difference.
“We knew we needed to visualize our internet superstructure for the dashboard to work. But we didn’t have the time or knowledge to build such a complex solution internally. The ReGraph toolkit made it quick and easy for our developers to bring the perfect visualization component into our dashboard.” – Jonas Simanavicius
The visualizations on the Synternet Stack dashboard make it a great visual communication tool for network engineers to share information with their management at every stage, whether demonstrating on-screen or using an illustrated PDF report.
Synternet’s mission is to “decentralize” the internet, and we’re excited to see how they use our visualizations in future as their technology develops. Visit the Synternet website to learn more about the Synternet platform.
Want to try ReGraph for yourself? Request a free trial.
Visualize your data! Request full access to our ReGraph SDK, demos and live-coding playground.
Registered in England and Wales with Company Number 07625370 | VAT Number 113 1740 61
6-8 Hills Road, Cambridge, CB2 1JP. All material © Cambridge Intelligence .
Privacy Policy | Security Framework


