The infrastructure visualization challenge
To build secure infrastructure, you need to understand connections.
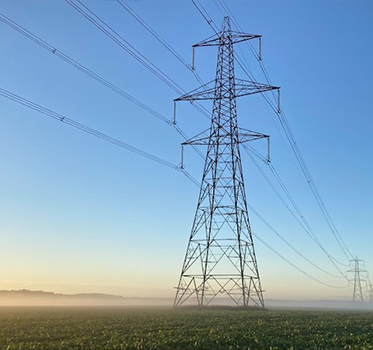
From the internet to gas pipelines, corporate IT systems to global telecoms networks: they’re all complex connected systems. A single point of failure can have a massive impact.
With every connected device or machine generating a digital footprint, it’s easy to produce infrastructure data on a massive scale. The challenge is joining the dots. That’s where network mapping software and data visualization plays a crucial role.
Interactive data visualization – especially network visualization, geospatial visualization and timeline visualization – is the best tool for making sense of complex infrastructure data.
Let’s see why.
Monitor: network mapping software
Every day, billions of events can take place in a single network. To make sense of these, analysts need to see what’s happening.
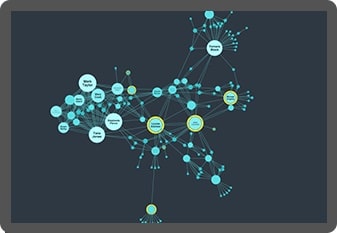
Using the right network mapping software, especially with geospatial and timeline visualization tools, it’s possible to generate dynamic network visualizations from critical infrastructure logs in seconds. These visualizations reveal structures, dependencies, and vulnerabilities that infrastructure managers can use to make systems more resilient and effective.
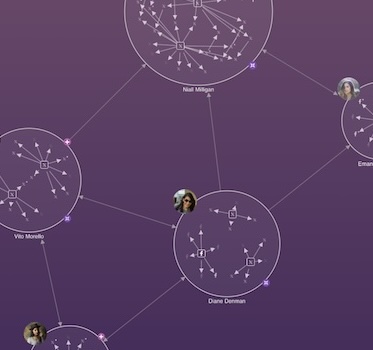
Network mapping software makes it easier and faster to uncover vulnerabilities and bottlenecks in critical infrastructure networks.
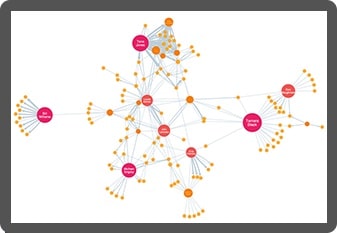
These scale from a single connection to tens of thousands, revealing network patterns and specific device behavior.
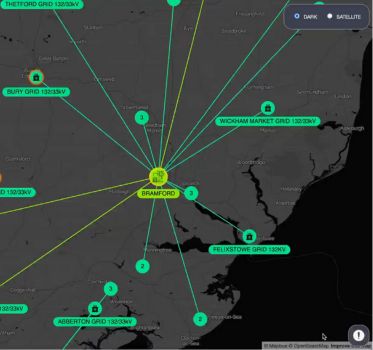
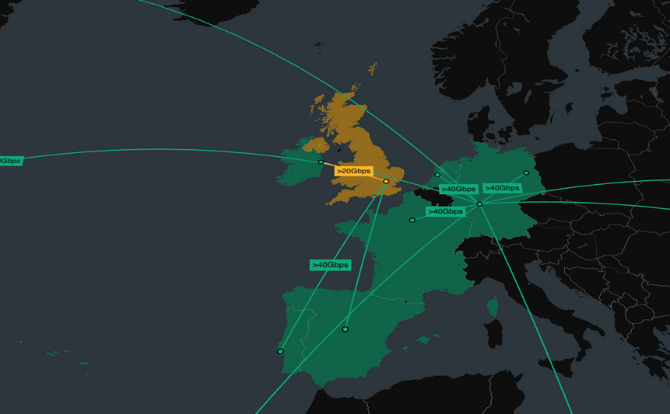
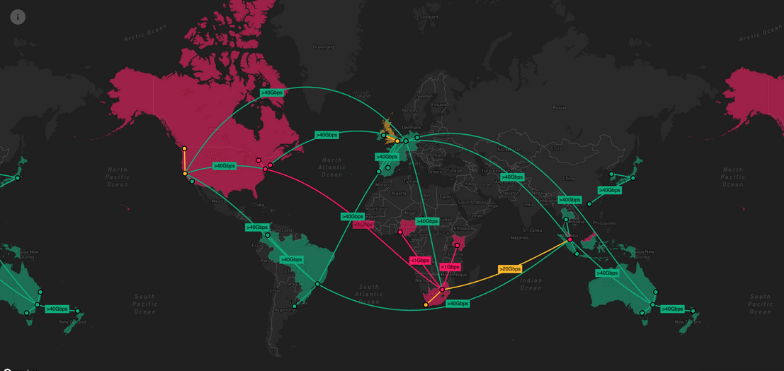
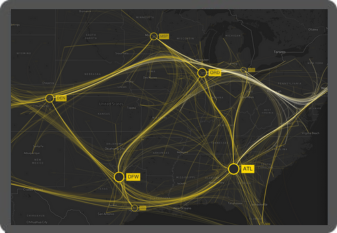
Geospatial visualization puts infrastructure events into a real-world context, giving comprehensive and intuitive views of infrastructure spanning multiple regions and domains.
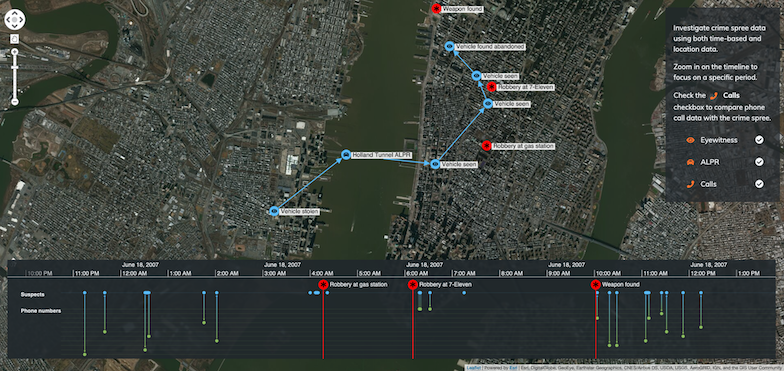
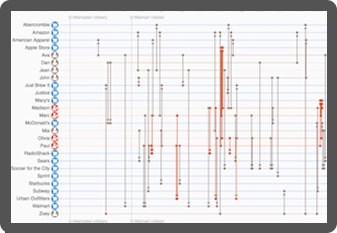
With a timeline visualization component, we can watch events unfold and connections as they form, revealing fast and valuable insight.
Learn more in our white papers
We’ve helped governments, banks, and leading software vendors visualize their data.
Investigate: understand network incidents
With complex and constantly evolving networks, incidents and outages are inevitable. Armed with effective network mapping software, infrastructure managers can identify and investigate problems, and respond to them quickly.
Root cause analysis, powered by advanced data visualization, reveals what happened during an incident: identifying vulnerabilities, faulty equipment or bottlenecks.
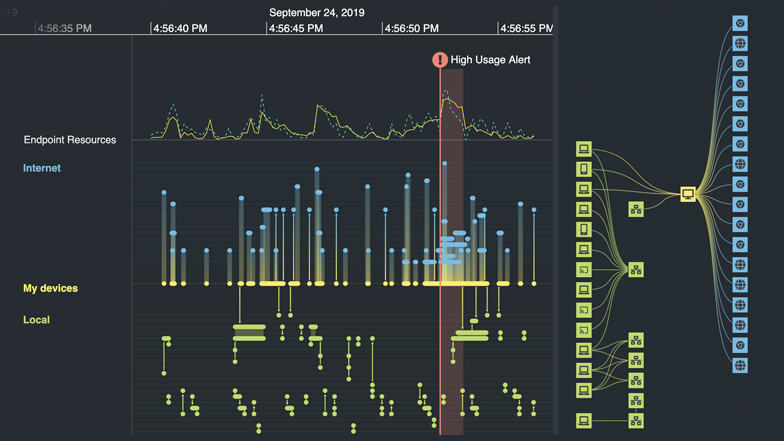
Infrastructure managers need to see cause and effect. Combining a network visualization and a timeline view reveals how and why incidents happen, and their impact on the network.
Custom network mapping software for infrastructure management
We work with businesses, governments and technology vendors worldwide to create the next generation of network mapping software.
Using our network, timeline and geospatial visualization technologies, they can build interactive applications that join the dots in complex critical infrastructure, revealing insight they need to understand.

Intuitive visualization
Discover new dimensions to infrastructure that other kinds of log analysis can’t show. Timeline, geospatial and network visualization reveals network structure and activity in a uniquely intuitive way, leading to faster insight.

Secure visualization
Design visualization tools suitable for the world’s most secure environments. They sit inside the firewall, don’t track users, never call home and can be easily SSL encrypted.

Visualization that scales
Our toolkits support visualization at scale. Whether you need to understand specific connections or a vast global network, our products scale to any size organization and operation.

Beautiful visualizations
Every aspect of the tools can be customized, from the functionality to the look and feel. The result: a beautiful chart that fits seamlessly with your application and your users love to use.
Want to try it for yourself?
KeyLines
The graph visualization SDK for JavaScript developers
KeyLines is your fast-track to graph visualization success on any tech stack.
ReGraph
Hassle-free graph visualization for React developers
ReGraph for React makes building state-based graph visualizations a breeze.
KronoGraph
Advanced timeline visualizations that scale quickly & easily
Build advanced interactive timeline views, customized for your applications.
MapWeave
Geospatial visualization SDK that uncovers every connection
Build apps that make geospatial connections clear and insightful.