
A lot has changed since we last explored using Memgraph with our graph visualization tools.
We’ve released our powerful toolkit ReGraph to provide the best experience for developers building graph projects in the React ecosystem.
Meanwhile our friends at Memgraph have hit the 1.0 milestone for their in-memory first approach to graph databases. This brought fantastic improvements to users already taking advantage of the fully-distributed database technology.
In this blog post I’ll try visualizing network infrastructure to demonstrate how quick and easy it is to get ReGraph working with Memgraph. We’ll build a network visualization of the fascinating system of energy pipelines routing electrical power across Europe.
Memgraph and ReGraph

When you’re choosing a graph database for your project, it’s important to consider the query language used to retrieve and traverse the underlying connected data in your database. Is it easy to use? Do developers like it?
Instead of building yet another query language that developers would have to learn, Memgraph uses openCypher for queries, and the Bolt protocol for database communications.
There’s already an amazing community of Neo4j developers using Cypher to wrangle their graph data. I’m a big fan of the GRANDStack from Neo4j but sometimes it’s more convenient to use the underlying libraries to leverage existing code and prototype projects. Other tools originally developed for Neo4j also work out of the box for Memgraph.
Our previous guide focused on using Memgraph with KeyLines, our graph visualization toolkit for JavaScript developers. The ReGraph API is built from the ground up with React developers in mind but it turns out it’s just as easy to wire up with Memgraph.
The integration section of this guide highlights how to query Memgraph via the Bolt protocol and Neo4j libraries. But first, let’s take a closer look at our energy grid dataset.
Visualizing network infrastructure
The energy grid is a classic case of network topology infrastructure use case with endless possibilities for analysis and visualization. Sometimes known as a power grid this is the intricate network of transformers, generators and electric lines that deliver electricity from producers such as power plants to consumers ranging from houses to businesses.
Managing, monitoring and designing these grids is an extremely intricate challenge as there is a myriad of considerations to make when routing. Graph visualizations reveal structures, dependencies and vulnerabilities that infrastructure managers use to make systems more resilient and effective.
The ENTSO-E is the European Network of Transmission System Operators for Electricity and oversees the management of a number of transmission systems delivering electricity across Europe. To get an idea of the complexity of their mission they have a fantastic learning tool called the power flow simulator.
I love exploring data that closely resembles the real world so I jumped at the chance to build a ReGraph application with data inspired by the ENTSO-E network. The data used in this blog post is on GitHub and our friends at Memgraph provided a transformed version of the data to load into Memgraph using Cypher.
The energy grid infrastructure data model
There’s a huge range of relevant information we could include in the model, such as power flows, switch settings (on or off), maintenance records and weather conditions. Storing this data inside the graph model would provide energy grid operators with a complete 360 real-time view of the grid, helping to improve short and long-term planning, keep operational costs down and reduce customer outages.
We’ve kept things simple and focused on the key elements of the grid for our data model. It features nodes representing grid lines, converters, transformers and generators linked to connection points called grid busses. Each element is a valuable part of the infrastructure so it’s important to model them separately. This also gives us the flexibility to write Cypher queries that target or ignore each node type as appropriate for the use-case.
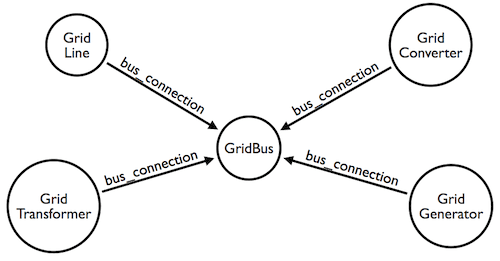
Simple but effective: our schema focuses on key elements of the grid.
Scalable layouts
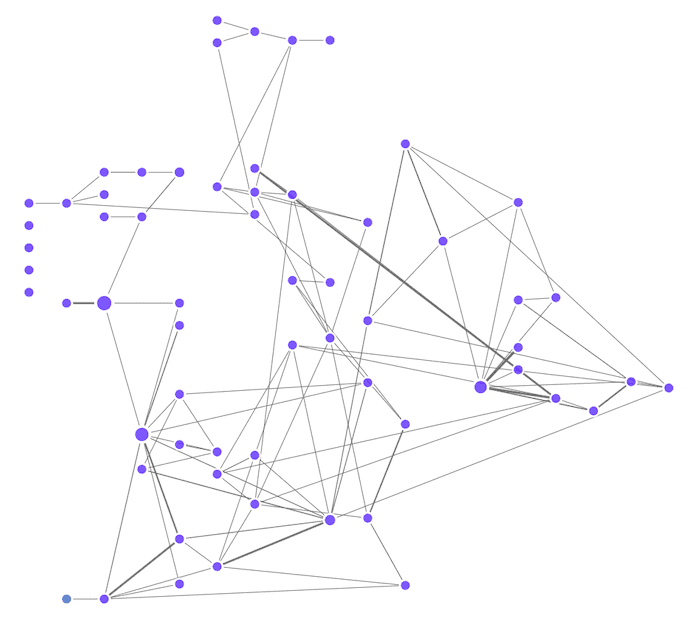
ReGraph can handle tens of thousands of nodes and links, right in the browser. Here’s a high-level view of the grid, using ReGraph’s organic layout to give an overall picture of the data structure.
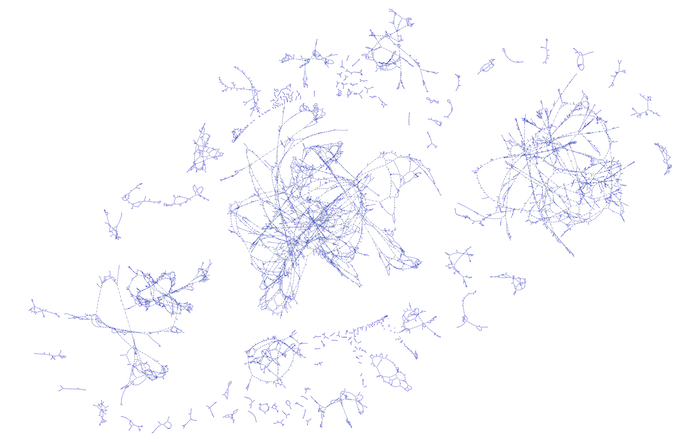
My Cypher query to retrieve this data is very straightforward. It’s a simple MATCH statement to return all nodes connected via a link:
MATCH (b)-[r]-(c) RETURN b, c, r;
This initial network of densely-connected items reveals the overall shape of the energy grid data. To add context, we need to see these components on a map.
Geospatial awareness
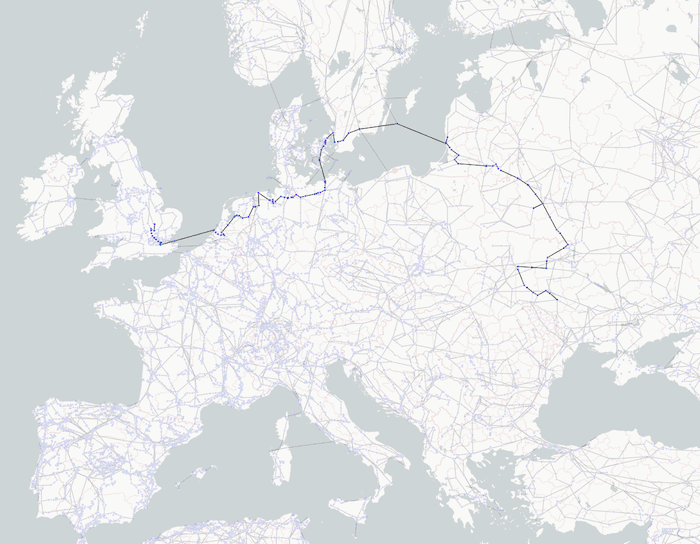
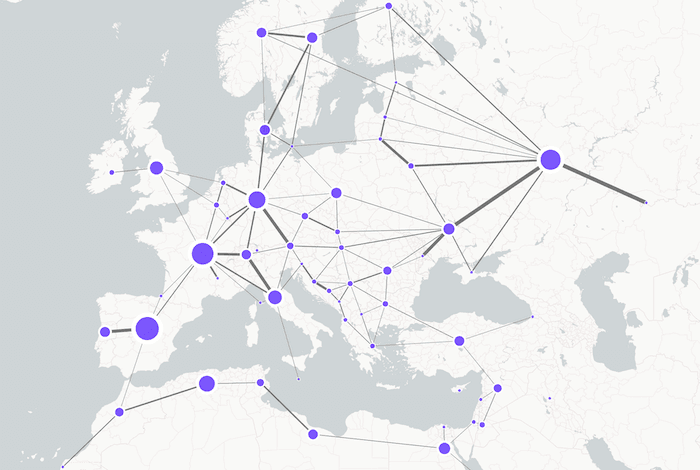
Combining graph and location data provides a rich source of insight. With geospatial coordinates for each of the nodes in the energy grid, we can easily plot our European network.
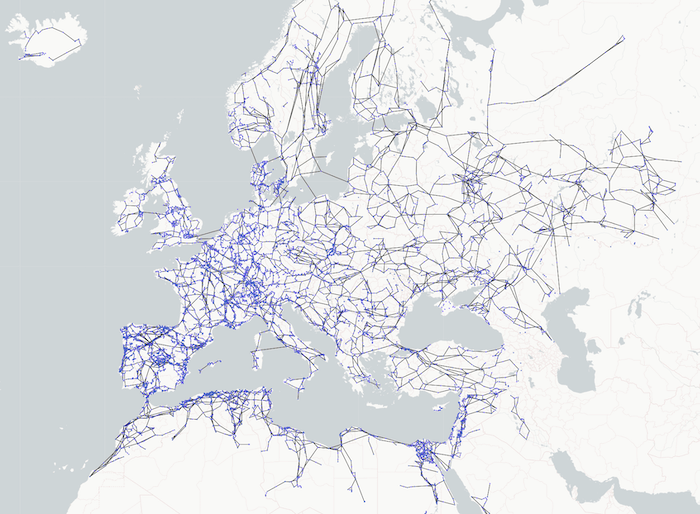
Even without labels, we can spot where the European capital cities are by the higher concentrations of connected nodes. The greater number of energy grid busses makes sure the lights stay on in those densely-populated areas.
There are many chart styling options available, but when you’re visualizing complex networks, it’s important not to overwhelm users. We’ve chosen a muted map background to emphasise the energy grid rather than geographic features. This makes it easier to spot when the grid traverses across seas and oceans.
For this high-level view we’ve decided not to clutter the nodes with decorations and have opted for a simple two-color scheme for energy grid lines and grid busses.
Which path to take?
One of the benefits of loading this data into Memgraph is the ability to outsource difficult graph calculations to the database. Following their guide we can write the following Cypher query to return the shortest path between two nodes in our database, taking into account the weight on the edges between them.
MATCH (a {id: 5286})-[edge_list *wShortest 30 (e, n | e.weight) total_weight]-(b {id: 14158}) RETURN *;
The query gives us a list of chart items that we can pass to ReGraph to highlight the shortest path of interest.
This type of network analysis is crucial to infrastructure managers. It helps uncover vulnerabilities and bottlenecks, model the impact incidents and outages may have on the network, and carry out critical contingency planning.
If we don’t want to run a fresh query against the database, we can use ReGraph’s own powerful graph analysis engine to find the shortest path in the browser:
shortestPaths(items, 5286, 14158, { value: 'weight' }).then((result) => {
 const newItems = { ...items };
 forEach(newItems, (val, key) => {
   if (!result.newItems[key]) {
     val.fade = true;
   }
 });
 setItems(newItems);
});
Smart node grouping using combos
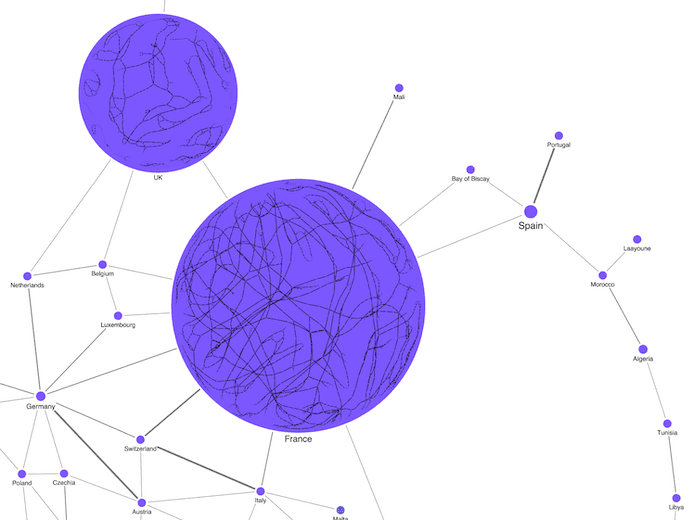
Different views of the same data can often reveal further insight.
Here we’ve combined nodes by country and sized them by how many data points they contain. The result is a far simpler chart, but with the option to double-click on a combo to reveal the country-specific network inside.
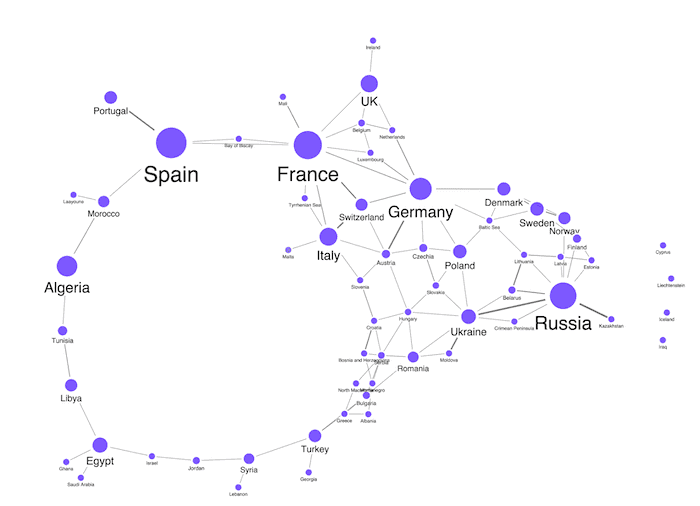
“Opening” these combos shows the grid inside the country in its own, self-contained node.
Investigating hierarchies
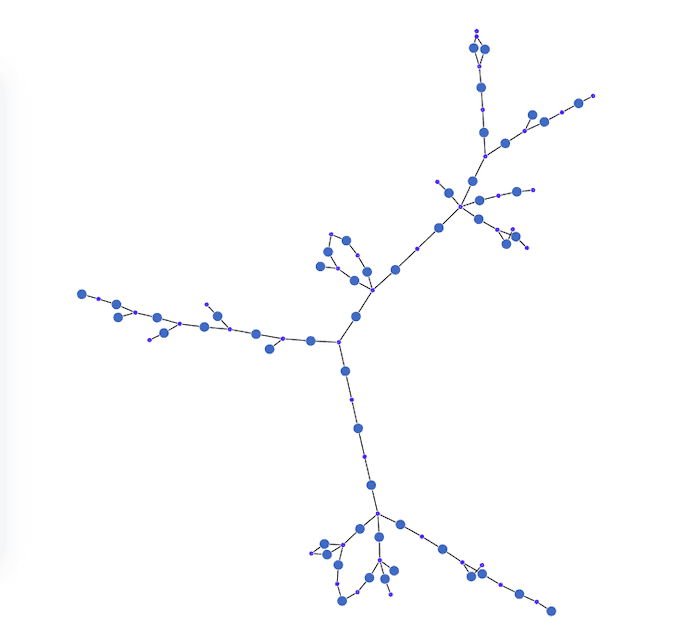
We can also take advantage of alternative layouts to get a different view of the same data.
This example of the sequential layout takes a hierarchical approach to the energy grid dataset, with tiers of data running right to left.
Using our geolocation coordinates, we can even overlay these combos back onto the map to see how heavily western Europe relies on reliable pipelines from the east.
Integrating Memgraph with ReGraph
For this blog post, I followed Memgraph’s quick start guide and chose the Docker approach as it’s trivial to create our database instance, ready for importing.
To allow ReGraph to talk to the graph, we’ve created a simple node.js Express Server. There are two endpoints: one for searching for strings, and the other for loading from a specific ID.
Now we just need a way to convert the Memgraph data into a format that ReGraph recognizes. Here’s where familiarity with Neo4j is our friend because the process is the same.
We simply install the neo4j-driver node module, so we can use openCypher and the Bolt protocol. Here’s a generalized snippet to allow us to talk to the database with the driver in JavaScript.
import neo4j from 'neo4j-driver';

import convertCypherResponse from './convertCypherResponse';

const queryCypherEndpoint = (url, query, options = {}) => {
 const driver = neo4j.driver(`bolt://${url}`, neo4j.auth.basic('', ''));
 const session = driver.session();
 let response;
 return session
   .run(query, {})
   .then((result) => {
     console.log(result);
     response = result;
   })
   .catch((error) => {
     console.log(error);
   })
   .then(() => {
     session.close();
     return convertCypherResponse(response);
   });
};

export default queryCypherEndpoint;
Once we get a response from the database we need to transform it into the format expected by ReGraph: a simple JSON object of nodes and links we want to visualize. I typically use the following code to provide ReGraph with chart items regardless of the type of response returned from the Cypher query.
import Neo4j from 'neo4j-driver';

const items = {};

const colors = [
 'rgb(73,116,201)',
 'rgb(204,153,255)'
];

const getProperties = (props) => {
 // helper function to normalize each property returned from neo4j const result = {};
 const ops = { Integer: 'toInt' };
 if (props) {
   Object.keys(props).forEach((key) => {
     const op = ops[props[key].constructor.name];
     if (op && typeof props[key][op] === 'function') {
       result[key] = props[key][op]();
     } else {
       result[key] = props[key];
     }
   });
 }
 return result;
};

const onNext = (record) => {
 // called for each record returned
 // handles nodes, relationships, paths & segments
 record.forEach((v, k, r) => {
   if (v instanceof Neo4j.types.Node) {
     try {
       makeNode(v);
     } catch (e) {
       console.log(e);
     }
   } else if (v instanceof Neo4j.types.Relationship) {
     try {
       makeLink(v);
     } catch (e) {
       console.log(e);
     }
   } else if (v instanceof Neo4j.types.Path) {
     makeNode(v.start);
     makeNode(v.end);

     v.segments.forEach((obj) => {
       makeNode(obj.start);
       makeNode(obj.end);
       makeLink(obj.relationship, obj.start.labels[0], obj.end.labels[0]);
     });
   } else if (v instanceof Array) {
     v.forEach((obj) => {
       try {
         if (obj instanceof Neo4j.types.Node) {
           makeNode(obj);
         } else if (obj instanceof Neo4j.types.Relationship) {
           makeLink(obj);
         }
       } catch (e) {
         console.log(e);
       }
     });
   }
 });
};

const makeNode = (v) => {
 // build a node object as ReGraph expects
 const data = getProperties(v.properties);
 data.type = v.labels.join(' ');
 const id = v.identity.toInt();
 items[id] = {
   label: { text, backgroundColor: 'transparent', color: 'white' },
   data,
   color: colours[0],
   size: 1,
 };
};

const makeLink = (e) => {
 // build a link (relationship) object as ReGraph expects
 const data = getProperties(e.properties);
 const id1 = `${e.start.toInt()}`;
 const id2 = `${e.end.toInt()}`;
 const id = 'link' + e.identity.toInt() + e.type;
 items[id] = {
   id1,
   id2,
   label: { text: e.type },
   data,
   width: 1,
   color: 'black',
 };
};

export const convertCypherResponse = (results) => {
 // call the converter for each record from the database
 results.records.forEach((result) => onNext(result));
 return items;
};

export default convertCypherResponse;
Finally we’ll put this together with the standard React pattern of useEffect and state management with Hooks:
import React, { useEffect } from 'react';
import { Chart } from 'regraph';

import { queryCypherEndpoint } from 'queryCypherEndpoint';

export default function NetworkContainer() {
 const [items, setItems] = React.useState({});

 // on first load, run an initial basic query
 useEffect(() => {
   const query = 'MATCH (b)-[r]-(c) RETURN b, c, r;';
   queryCypherEndpoint('localhost:7687', query).then(({ items }) => {
     setItems({ items });
   });
 }, []);

 return ;
}
That’s it – integration complete.
See for yourself
If you’re new to Memgraph or ReGraph, you’ll now have enough information to get started on your integration.
If you’re ready to see what ReGraph could do for you, request a free trial or get in touch.
Share:
