
KeyLines is flexible enough to work with any datastore, but it’s an especially good fit for graph databases.
In this blog post, we’re showcasing how to integrate KeyLines with the Memgraph database, our latest technology alliance partner. We’ll also use Memgraph’s TED Talks dataset to show how visualizing your graph data can reveal hidden insight.
![]()
MemGraph visualization tutorial with KeyLines
Memgraph is a fully-distributed graph database primarily aimed at financial, telecommunications and retail enterprises. Its in-memory first approach aims to deliver high performance, making it a good choice for working with real-time data at scale. With deployment options for both on-premise and cloud, it also delivers the high levels of security you’d expect from an enterprise solution.
To existing Neo4j users, Memgraph will seem very familiar. It uses openCypher for queries, and the Bolt protocol for database communications. Other tools originally developed for Neo4j also work out of the box for Memgraph, including the neo4j-client and the JavaScript library neo4j-client.js.
This means graph database visualization with Memgraph and KeyLines is just as seamless as with Neo4j. More on the technical integration details later. First, let’s explore the dataset we’re visualizing here: the diverse world of TED Talks.
MemGraph visualization tutorial: Analyzing TED Talks
You’re probably familiar with the nonprofit global community called TED. Its mission is to spread ideas on pretty much every topic – from science to business to global issues – mainly through short, powerful, highly-accessible talks.
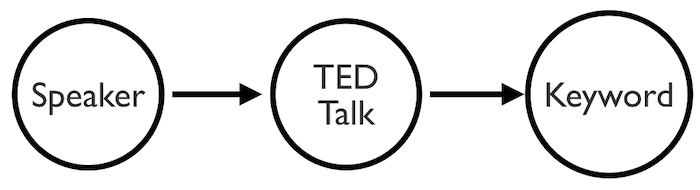
Memgraph created a simple data model based on a small TED talk dataset. We’ve simplified it further to focus on links between nodes representing TED speakers, with other nodes representing the talks they gave. There’s another node for the keywords those talks are tagged with. These cover a diverse range of subjects – everything from dance to psychology.
Memgraph’s documentation features a tutorial on how to retrieve interesting and useful information from their graph database. By integrating with KeyLines, we go one step further and bring this data to life. Let’s see what additional insight we can find about the most popular TED topics.
Understanding structure with layouts
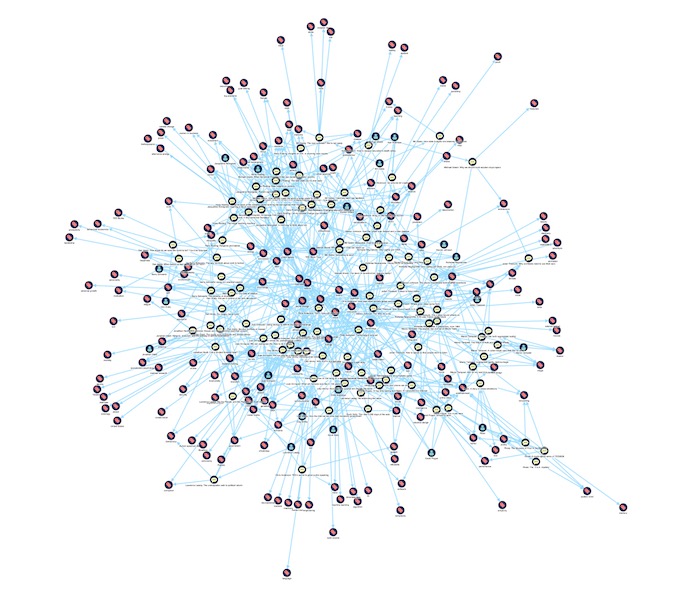
Here, we’ve used KeyLines’ organic layout to give an overall picture of the data structure.
Notice how highly-connected nodes – prolific speakers and the most popular topics – are clustered at the center, while those with fewer connections are displayed in a circular pattern at the edges.
These nodes around the edges represent the least popular keywords. Most are associated with a single talk.
It’s difficult to get further insight without zooming in, but there are a few KeyLines features to help us, starting with Social Network Analysis (SNA) measures.
Styling nodes by pageRank
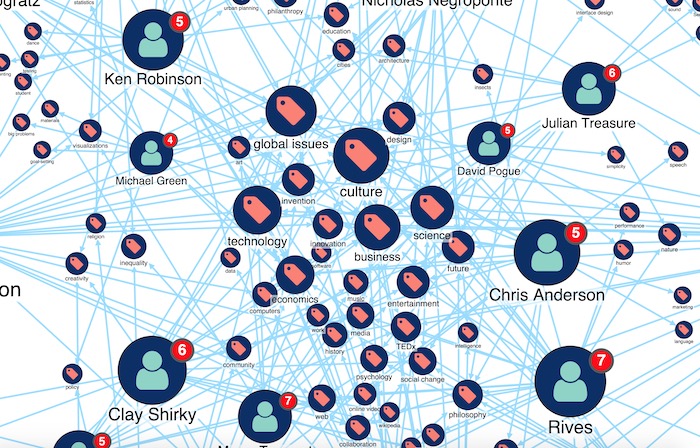
Here, we’ve used KeyLines’ Social Network Analysis (SNA) pageRank measure to identify important topics and talks. Nodes are sized according to the number of incoming links they have, so it’s much easier to spot which ones are most popular.
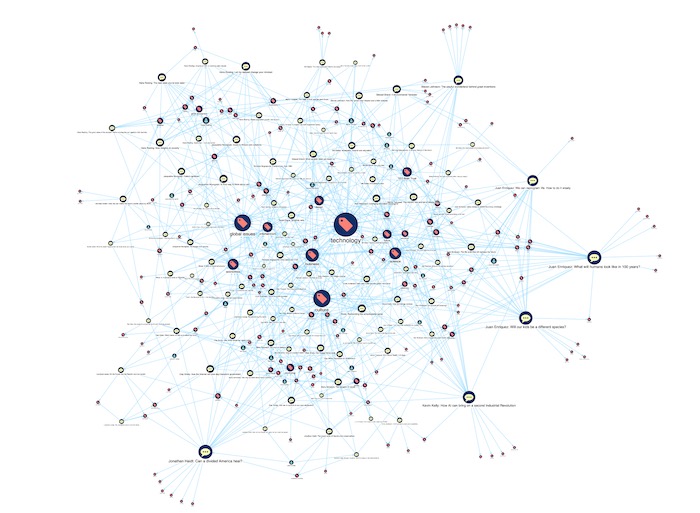
Right away, it’s easy to identify ‘technology’ as the most commonly used TED talk keyword. But why is that? Let’s do some further analysis to gain a greater understanding of how that keyword is used.
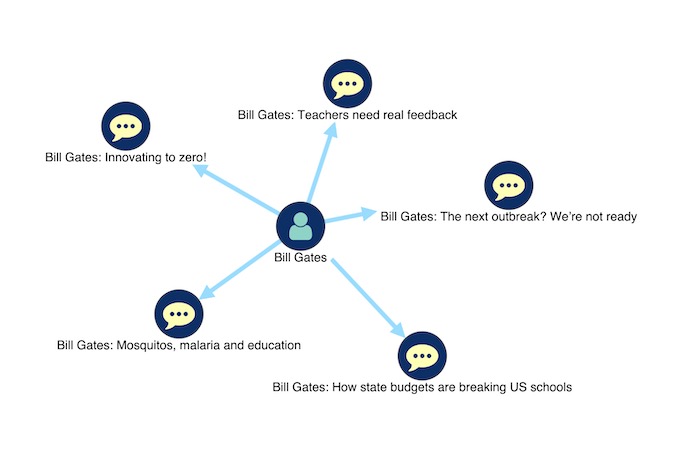
Finding new perspectives with combos
Let’s go deeper. We’ll update the chart with combos to group talks by speaker. Decluttering charts in this way means you can focus on what’s important.
Now when we rerun the pageRank algorithm, we get some insightful results.
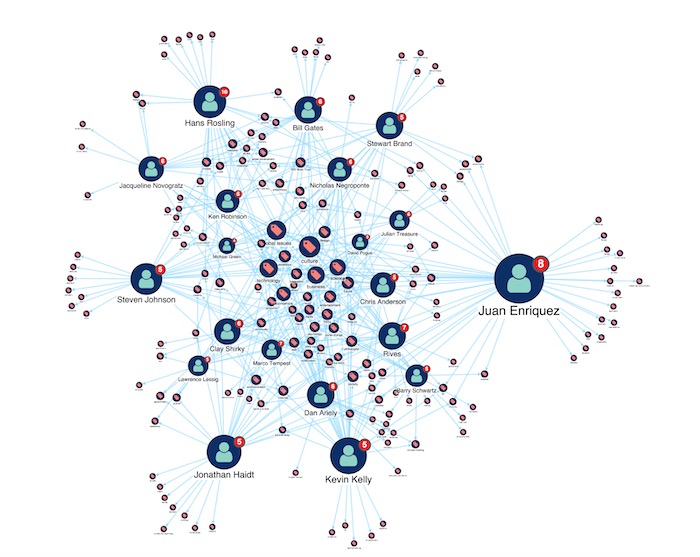
It’s clear from the node size that Juan Enriquez is associated with the most keywords, so we can assume his talks (confirmed as 8 by the node glyph) cover a wide variety of topics. By recognizing the modest size of each keyword node he’s linked with, we can see that those topics are not as popular as others in this dataset.
But what about our most popular ‘technology’ keyword? We can zoom into the central cluster of the most densely-connected nodes to find out.
The ‘technology’ keyword is still popular, but it’s not the most popular in this combined view. The size weightings show that ‘culture’ is used most frequently, closely followed by ‘global issues’.
We could infer that there’s a small number of highly-prolific technology speakers skewing our previous results. In this way, KeyLines helps uncover new perspectives that could help target further analysis. An effective way to do this is by searching for items of interest.
Drilling into the graph data
Clicking a node foregrounds that item and its neighbors, letting you focus on the data you’re most interested in.
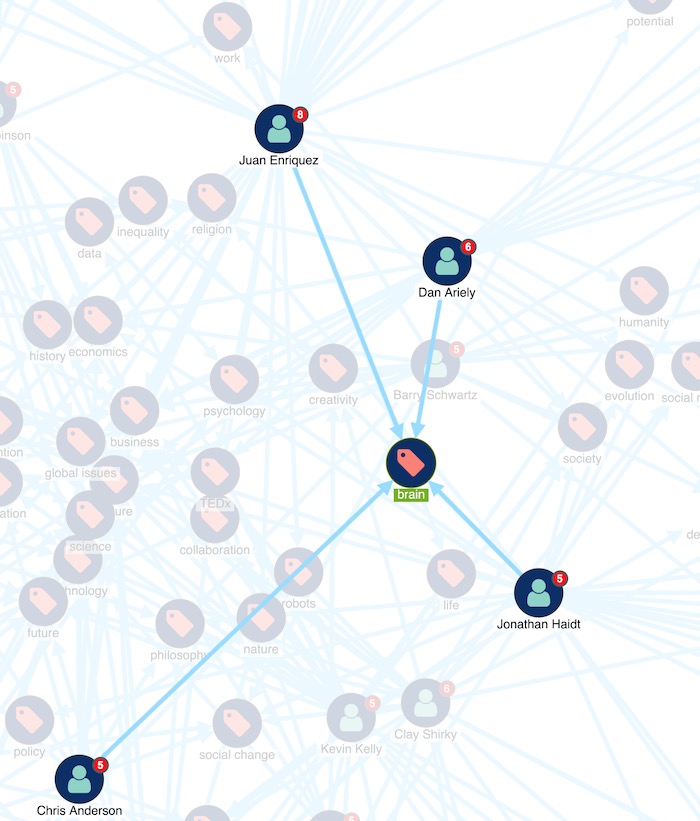
A flexible approach to exploring the Memgraph database through KeyLines is using a simple search box. Under the hood, Cypher queries retrieve matches, together with their neighbors. On the chart, KeyLines displays the relevant search results in isolation.
You can explore further by expanding nodes, dynamically bringing in additional connections from the database.
Integrating Memgraph with KeyLines
For this MemGraph visualization tutorial, we followed Memgraph’s Analyzing TED Talks tutorial. We chose Docker: the easiest option to import their database snapshot.
Using their docker container means you can start Memgraph with a single command, no matter which operating system you’re running.
To allow KeyLines to talk to the graph, we’ve created a simple node.js Express Server. There are two endpoints: one for searching for strings, and the other for loading from a specific ID.
Now we just need a way to convert the Memgraph data into a format that KeyLines recognizes. Here’s where familiarity with Neo4j is our friend because the process is the same.
We simply install the neo4j-driver node module, so we can use openCypher and the Bolt protocol (check out our blog post on Hooking KeyLines up to the Neo4j Bolt Protocol).
The default Bolt port is different, so we use the following definition in our node.js code to connect to Memgraph:
try {
  const driver = neo4j.v1.driver(
    'bolt://localhost:7687',
    neo4j.v1.auth.basic('', ''),
    {
      disableLosslessIntegers: true
    }
  );
} catch (e) {
  console.log(e);
}
We’ve set disableLosslessIntegers to true, because we want real JavaScript numbers rather than objects representing high and low bits. This is fine because we’re only handling 32-bit numbers, not the 64-bit numbers Memgraph and Neo4j are capable of.
That’s it – integration complete. We hope you found this MemGraph visualization tutorial helpful! Now you’re ready to focus on the KeyLines features we’ve highlighted in this post, including combos, SNA measures, node styling, and search facilities.
See for yourself
If you’re new to Memgraph or KeyLines, you’ll now have enough information to get started on your own MemGraph integration. Visualizing TED Talks data in KeyLines also outlines the kind of powerful insight you can find in datasets, where a closer investigation into what seems true can sometimes lead to new discoveries.
If you’re ready to see what KeyLines could do for you, request a free trial or get in touch.
Share:
