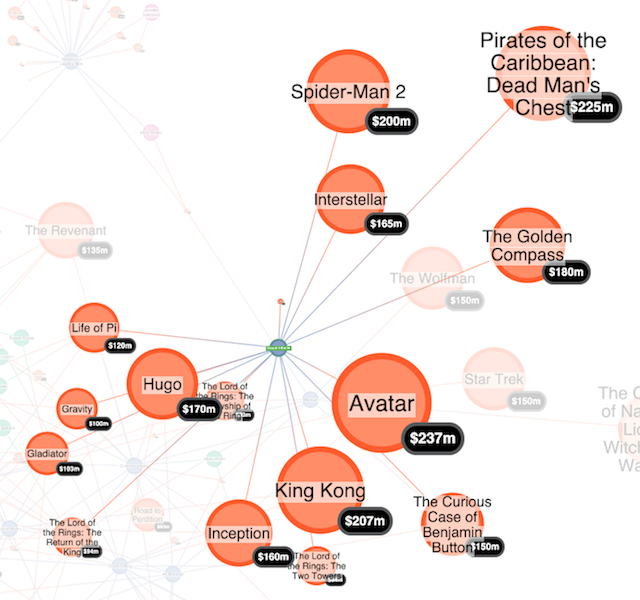
How to visualize a Stardog knowledge graph
Duncan Grant Sales Engineer
28th January, 2019 | 8 min read
This blog post shows how quick and easy it is to integrate Stardog with KeyLines using Academy Awards data....
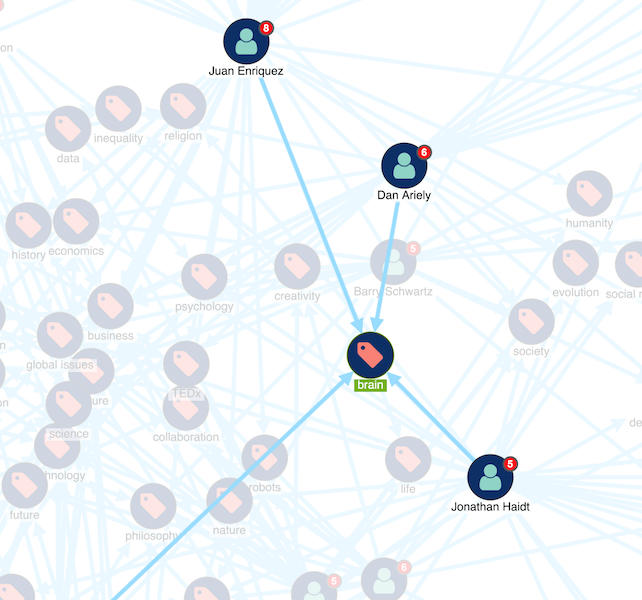
MemGraph visualization tutorial: visualizing TED Talks data
Duncan Grant Sales Engineer
26th November, 2018 | 7 min read
Learn how to integrate the KeyLines graph visualization toolkit with Memgraph. We’ll visualize TED Talks for...
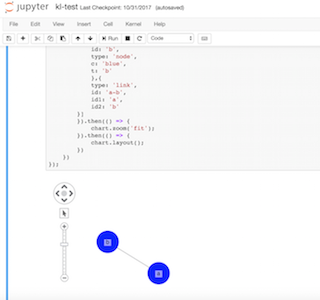
Python graph visualization using Jupyter & KeyLines
Duncan Grant Sales Engineer
8th January, 2018 | 5 min read
Sharing intelligence is a key part of every graph analysis workflow. Once your connected data has been explored,...
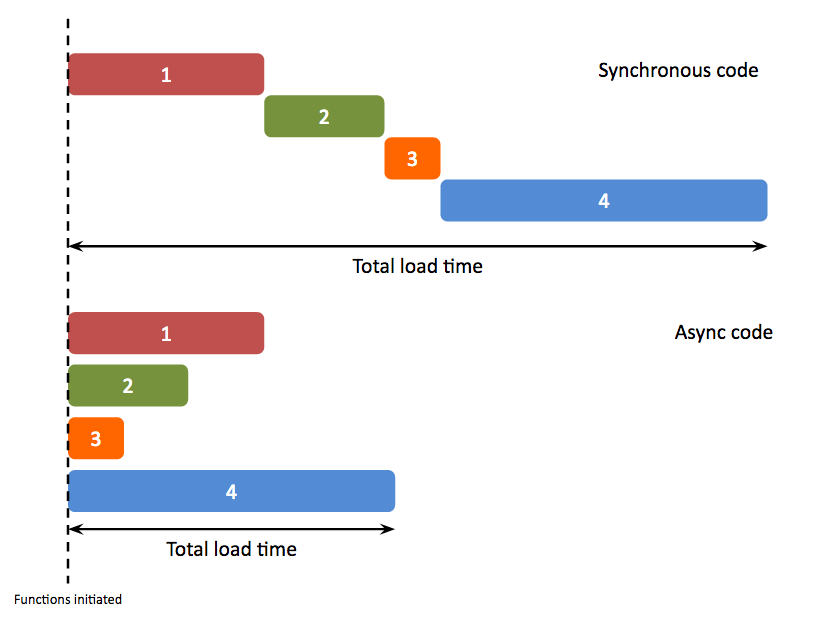
Using JavaScript Promises in KeyLines
Duncan Grant Sales Engineer
18th January, 2017 | 5 min read
Introducing asynchronous code and basic Promises In KeyLines 3.3, we announced support for JavaScript Promises. We...
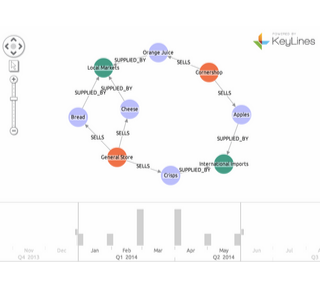
How to visualize Neo4j time series data
Duncan Grant Sales Engineer
7th January, 2015 | 8 min read
In this tutorial, you’ll learn how to use the KeyLines time bar to visualize Neo4j time series...
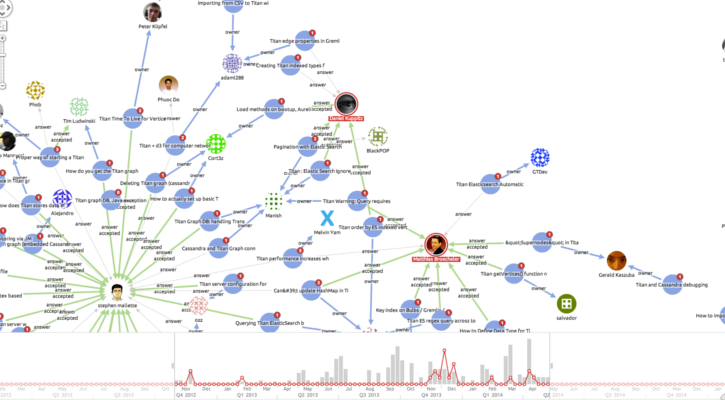
Visualizing Stack Overflow
Duncan Grant Sales Engineer
14th October, 2014 | 9 min read
Discover how to visualize data from the Stack Exchange / Stack Overflow API using the KeyLines graph visualization...
