
In this blog post, we’ll visualize a Stardog knowledge graph, using our KeyLines technology to bring it to life.
We recently rolled out the red carpet to welcome Stardog to our Technology Alliance. This blog post shows how quick and easy it is to integrate their enterprise knowledge graph technology with KeyLines.
![]()
And as the nominations for the 91st Academy Awards have just been announced, we thought we’d bring some Hollywood glamor to our Stardog graph visualizations. Let’s see what insight we can gain from visualizing multiple sources featuring Academy Awards data.
First, a bit more about Stardog.
Stardog knowledge graph & KeyLines
Stardog, leading provider of enterprise knowledge graph technology, partners with some of the largest organizations in the world, including Morgan Stanley, Bosch and NASA. Like KeyLines, Stardog aims to help organizations overcome data silos. Key to their mission is providing simpler ways to unify, query, search and analyze their enterprise data, no matter what kind of data it is, where it’s stored or how frequently it’s updated.
The Stardog knowledge graph platform combines graph database technology with an AI-based knowledge toolkit. It uses a Resource Description Framework (RDF) data model, where data is expressed using a syntax called Terse RDF Triple Language (Turtle) and queried using SPARQL.
KeyLines’ database-agnostic approach means it’s quick and easy to achieve integration with Stardog’s knowledge graph technology. We’ll cover the technical integration details later. For now, let’s take a closer look at our Oscar winners.
Understanding our star-studded dataset
We’ve used two different datasets from Kaggle. One features every Oscar nominee and winner from 1927 to 2015, and the other contains the budget spent on each film.
After fixing some data errors, we have a simple data model with:
- nodes color-coded by type (movie, actor, director and award)
- links between people who worked on a particular movie
Here’s the entire dataset:
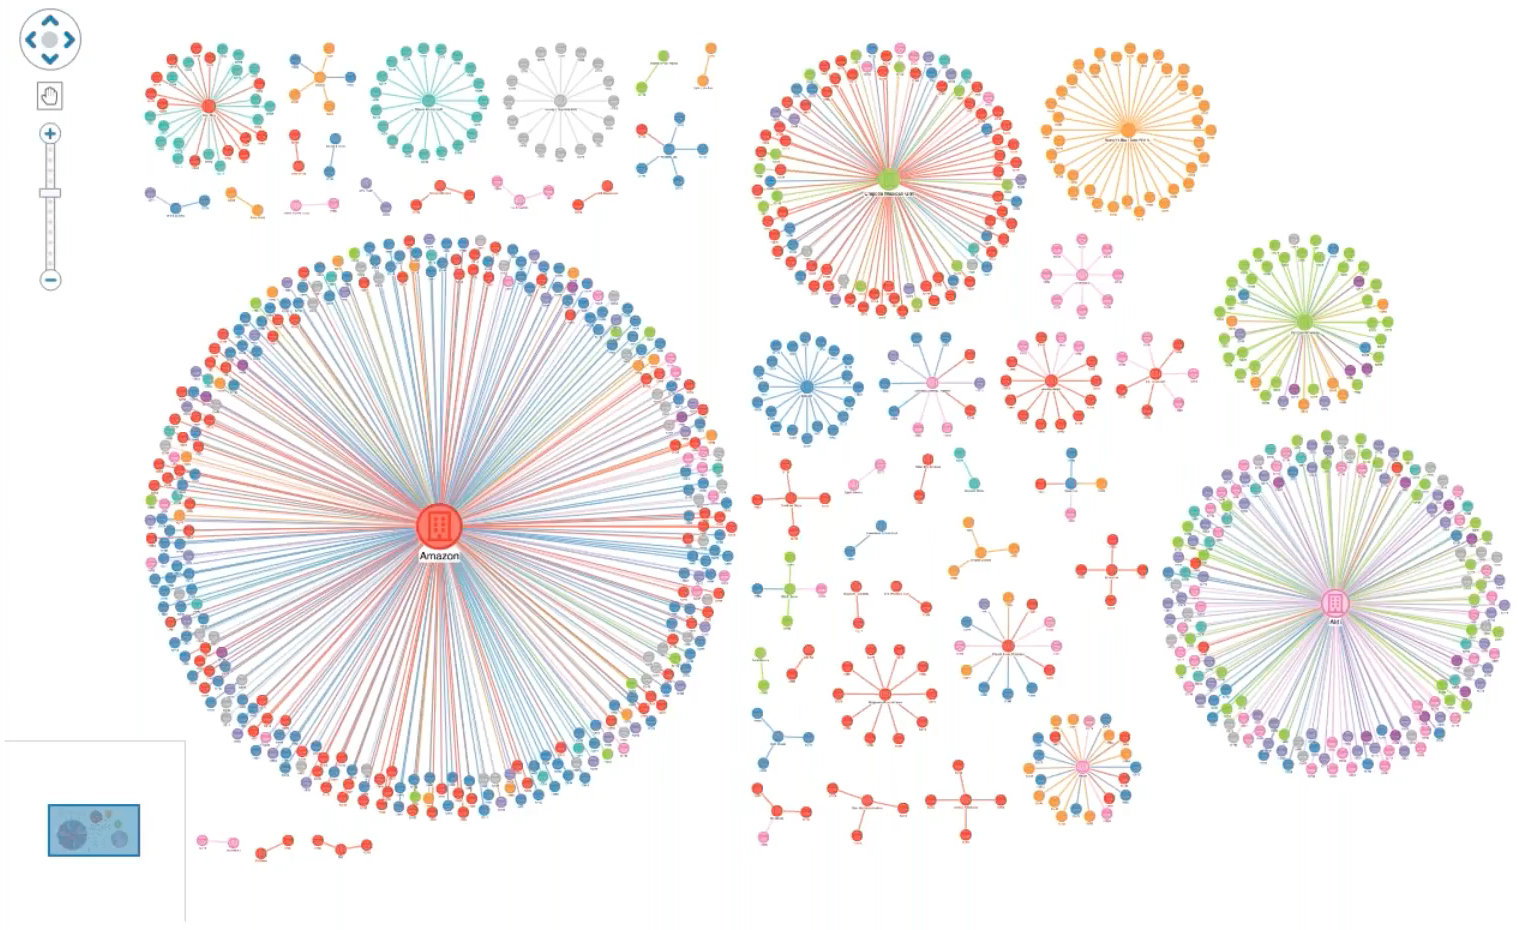
This visualization is too vast to extract meaning from right now, so let’s focus on a subset and see what we can find.
Creating graph visualizations your way
KeyLines offers some easy-to-use styling and filtering options to give your analysts the power to create customized visualizations.
The KeyLines time bar lets you focus on activity that occurred at an instant in time or during a specific time period. Let’s focus on the Oscars between 2000 and 2015. Let’s also simplify things further by only bringing in award winners from the Stardog database, ignoring data about unsuccessful nominees.
The overall structure gives a clearer view of the entire dataset:
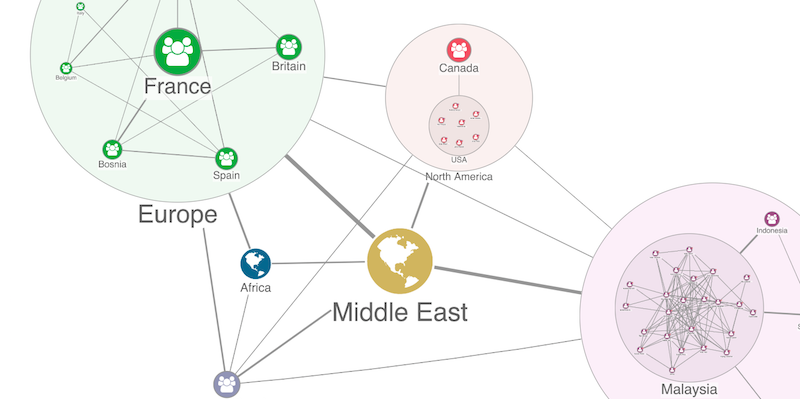
Organic layout presents the overall structure
This organic layout displays actor and film nodes ‘fanning out’ from individual award categories (represented as purple nodes). The more densely-connected nodes in the center represent films or individuals that won multiple awards. Winners in fewer award categories are more spread out around the periphery of the chart, connected by elongated links.
Now we’re ready to start analyzing further. Let’s find the films that won the most academy awards during our 15 year time period.
Identifying big winners in the Stardog knowledge graph
The graph engine that powers KeyLines’ analysis features is separate from the methods used to render charts. This is great for performance because it means you can run complex analysis without having to display every chart item first.
Let’s apply some quick and easy analysis to our graph visualization to find which movies were most successful. We’ll use the neighbors graph feature to count the number of immediate links each movie node has to an award.
We’ll size nodes according to results so they’re easy to spot and display movie budget details as glyphs.
It’s clear who the biggest winner was. In 2004, The Lord of the Rings: The Return of the King won every academy award it was nominated for, joining Titanic and Ben-Hur as the only movies ever to have won 11 Oscars each.
Following up in quick succession are Slumdog Millionaire with 8 wins, Gravity with 7, and Chicago, The Hurt Locker and Max Max: Fury Road with 6 each.
Now we know who won, the next question is why.
So many factors contribute to making brilliant films, but can we identify patterns? We already have data on how much money went into producing each movie, but does big-budget guarantee awards?
How much does it cost to win an Oscar?
Let’s apply neighbors graph analysis to our winners again, but this time we’ll size results by budget.
The results prove that multi-Oscar winners don’t always rely on high dollar: none of the top 6 award-winning films coincide with the top 6 movies sized by budget.
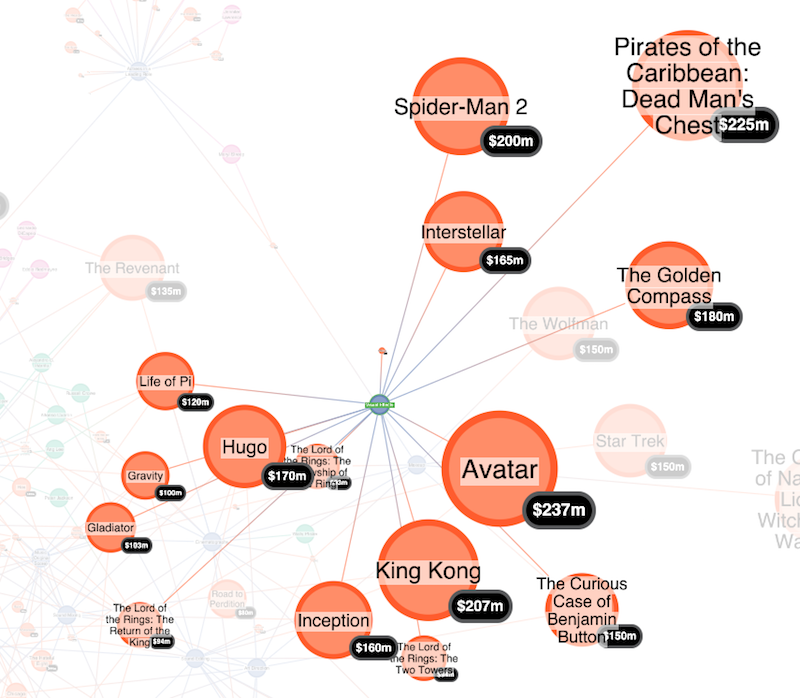
Oscar winners with the highest budgets
A few movies stand out – Avatar had an initial outlay of $237m and won 3 awards. Pirates of the Caribbean: Dead Man’s Chest came a close second, costing a whopping $225m but only winning 1 of the 4 Oscars it was nominated for.
After those, there’s a handful of films with budgets around $200m – Spider-Man 2, King Kong, Alice in Wonderland and Toy Story 3. Two of them won more than 1 award (Alice in Wonderland won 2; King Kong won 3).
These findings give us another line of investigation: what else do these winners have in common?
[widget id=”custom_html-71″]
Does budget influence specific awards?
All but one of our top six big-budget movies were nominated for best visual effects. The exception is Toy Story 3, which can’t be judged in that category because it’s an animation.
Does this mean you have to spend big to win best visual effects? Let’s dig deeper, this time taking into account the budgets of just those movies that won for their artistry and skills of visual illusion.
This visualization confirms that movies with larger budgets do tend to win in this category. Only four winners managed it with budgets below $100m, including the 11-time Oscar winner, The Lord of the Rings: The Return of the King.
They might not win as many accolades on Oscar night, but those big-budget blockbusters make great business sense. Pirates of the Caribbean: Dead Man’s Chest was the highest-grossing film of 2006, and Avatar is the highest-grossing film of all time.
Integrating Stardog with KeyLines
You’ll find official resources – including tutorials and detailed documentation – on Stardog’s site, and a full Stardog integration demo on the KeyLines SDK site (request a trial account here).
This overview describes how we visualized our Oscars data from Stardog’s graph database.
First, we needed to get our data into the RDF Turtle syntax Stardog recognizes. We did this using a node.js script to parse through our CSV line by line and convert it to triples. These are statements containing a sequence of three separate terms (subject, predicate, object). There’s more information about this standard at W3C.
Once the data was in the right format, the integration was straightforward. We used the command line to start the server and set up an admin web UI on localhost:5820:
stardog-admin server start
Next we created a new Stardog database called ‘oscars’:
stardog-admin db create -n oscars
Then we used a single command to load every triple from our Turtle file into Stardog:
stardog data add oscars oscars.ttl
We already had KeyLines running in our web application. With our graph database already created, we just needed to add Stardog to the app.
This was easy. We just installed the stardog.js node module, a universal JavaScript fetch wrapper for communicating with the Stardog HTTP server.
With Stardog installed, KeyLines could send SPARQL queries to the Stardog server. For example, to return the entire dataset, we ran:
select * where {
  ?s ?p ?o
}
To retrieve movies that have won at least one Oscar along with their object properties, we used:
PREFIX : <https://example.org/oscars/>

select * where {
  ?film a :Film;
    :isWinner true;
    ?props ?values
}
Stardog returns JSON data describing each result matched in the query. Finally, the SPARQL data is converted into KeyLines chart format so we can visualize results.
That’s our integration complete. The process would be even simpler if your data was in RDF format already. Just a few lines of code let us combine Stardog’s graph database technology with the powerful visualization features in KeyLines.
And the winner is… the Stardog knowledge graph
Dogs might be exempt from Oscar nominations, but they have been known to steal the show on awards night. If you give KeyLines and Stardog leading roles in your organization, you’ll uncover actionable insight fast.
We can’t get you into a celebrity after-party, but we can let you try our award-winning graph visualization tool. You’ll find a downloadable example featuring a Stardog integration along with nearly 100 other useful, fully-coded demos on our SDK site.
Request a free trial or contact us.
[widget id=”custom_html-53″]
Share:
