
Sharing intelligence is a key part of every graph analysis workflow. Once your connected data has been explored, filtered, combo’d, and generally understood by an analyst, their next step is to share their new-found insight with colleagues.
There’s already functionality in KeyLines, our graph visualization SDK, to facilitate that – serialise, export as PNG, etc – but how about integrating with the tools your analysts already use?
The beauty of KeyLines as a library is that integrating with other technologies is usually simple. In this blog, we’ll see how KeyLines can plug into Jupyter Notebook.
Using ReGraph instead of KeyLines?
See our blog post on integrating ReGraph with JupyterLab
What is Jupyter Notebook?
To quote the Jupyter website:
Jupyter Notebook is an open-source web application that allows you to create and share documents that contain live code, equations, visualizations and narrative text.
It’s an app that gives analysts a single place to clean, model, analyze and visualize their data. You can embed other tools and technologies, and multiple analysts can work together on a single notebook. We’ve found it’s especially popular with data scientists in domains like intelligence and cyber security where collaboration and insight sharing is critical.
Historically, Jupyter Notebook was for sharing and prototyping in Python – that’s where the ‘py’ in Jupyter comes from. These days you can use many other languages, including (crucially for KeyLines) JavaScript.
Why integrate KeyLines and Jupyter?
Within a single notebook you could have multiple languages (Python, Haskell, JavaScript, etc.,) each one held in its own ‘cell’, passing data to the next cell. Add in visualization libraries and a notebook becomes a powerful tool to manipulate and understand datasets.
Clearly, if you’re working with connected data inside Jupyter, embedding KeyLines will be very useful. Happily, it’s also very straightforward…
Embedding KeyLines in Jupyter Notebook
In this article, I’m using Jupyter Notebook version 6.1.5. We can’t guarantee these steps will work for all future versions, but if you do have any problems, our excellent support team is on hand to help.
Step 1: Set up the directories
The first thing to do is download your KeyLines files from the SDK site (request a KeyLines trial account here if you don’t already have one).
Next, create a new directory for the notebook, and then make the keylines.js file accessible to it. The easiest way to do this is to move it to your nbextensions folder, which is created by default when you install Jupyter Notebook. On my Mac machine, this global directory can be found at: ~/.ipython/nbextensions.
Step 2: Create a new notebook
Now create a notebook in the same directory as the assets folder, and load it to see your blank starting point.
Step 3: Set to JavaScript and configure settings
The default language for your notebook will probably be Python. To start writing JavaScript in a new cell, at the top of the cell, enter:
%%javascript
By default, there are two JavaScript libraries available for us to use without having to do a manual import: jQuery and require.js. Both of these will be useful for our KeyLines integration.
We start our integration by making sure that on subsequent runs of our notebook/cell the keylines div is cleared from the page. To do this we use jquery:
$('#kl').remove();
Jupyter also has a global variable called ‘element’. This is the DOM element in which we can render the results of our cell (appearing below the cell). In our next line of JavaScript, let’s append a div for KeyLines to use:
element.append('<div id="kl"style="width:200px;height:200px"></div>');
We could change the width/height of our chart, but this default is fine.
Step 4: Get the KeyLines library
Now let’s use require.js to get the KeyLines library we previously installed in the nbextensions directory. Within the callback of require, we have complete access to the KeyLines API.
require(["nbextensions/keylines"], function (KeyLines) {
    // We can use the KeyLines API as normal in here
    KeyLines.promisify();
    KeyLines.create({type: 'chart', id: 'kl'}).then(chart => {
        chart.load({
            type: 'LinkChart',
            items: [{
            id: 'a',
            type: 'node',
            c: 'blue',
            t: 'a'
            },{
            id: 'b',
            type: 'node',
            c: 'blue',
            t: 'b'
            },{
            type: 'link',
            id: 'a-b',
            id1: 'a',
            id2: 'b'
        }]
        }).then(() => {
            chart.zoom('fit');
        }).then(() => {
            chart.layout();
        })
    })
});
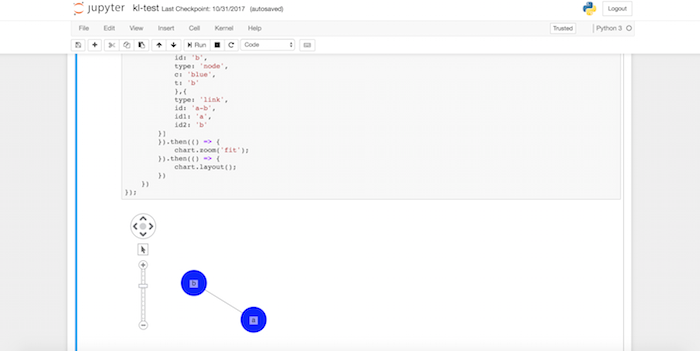
Now you just need to click ‘run’ on the notebook or cell and that’s it! You should have a KeyLines chart sitting inside your Jupyter Notebook.
Step 5: Interop with Python (optional)
We can take this integration one step further and add a Python connector. This lets us pass processed data from a Python cell to your KeyLines JavaScript cell, with the help of an iPython library.
In cell 1, we serialize some data into KeyLines JSON, and assign that to a global variable on the JS window object from within python:
import json
# create json in python
data = json.dumps({
   'type': 'LinkChart',
   'items': [{
   'type': 'node',
   'id': 'n1',
   'c': 'blue',
   't': 'node 1'
}]})
from IPython.display import Javascript
#runs arbitrary javascript, client-side
Javascript("""
          window.data={};
          """.format(data))
Then in cell 2, we can access the global variable containing the JSON directly:
%%javascript
console.log('KeyLines data', data);
Try it for yourself
Are you inspired to enrich Jupyter with graph visualization? Request a free KeyLines trial, and let us know how you get on!
You might also find our blog post on Python graph visualization with ReGraph useful.
Jupyter, Jupyter Notebook and Project Jupyter © of Project Jupyter
Share:
