This post was published some time ago.
It’s still useful, but it’s worth searching for up-to-date information in one of our more recent blog posts.
In particular, these Neo4j integration posts might be useful:
Graph databases are great for understanding the richness and complexity of the world around us. Data that would previously be shoehorned into relational databases now sits comfortably in a graph database and be stored and queried in a logical, natural and easy way.
An important part of the richness and complexity of graph data is how it changes through time. Graphs are almost always dynamic – they change shape and size, as time passes. New connections form and old ones break all the time.
Our graph visualization toolkits provide full support for dynamic graphs such as the world’s most popular graph database – Neo4j.
In this developer tutorial, we use the KeyLines time bar to visualize how your Neo4j time series data evolves. You’ll learn how to integrate with Neo4j quickly and easily so you can start building a time-based data visualization.
Visualizing Neo4j time series data: the basics
KeyLines is a JavaScript SDK for building graph visualization applications. It works with pretty much any data source, but is an especially great fit for Neo4j thanks to the shared data approach.
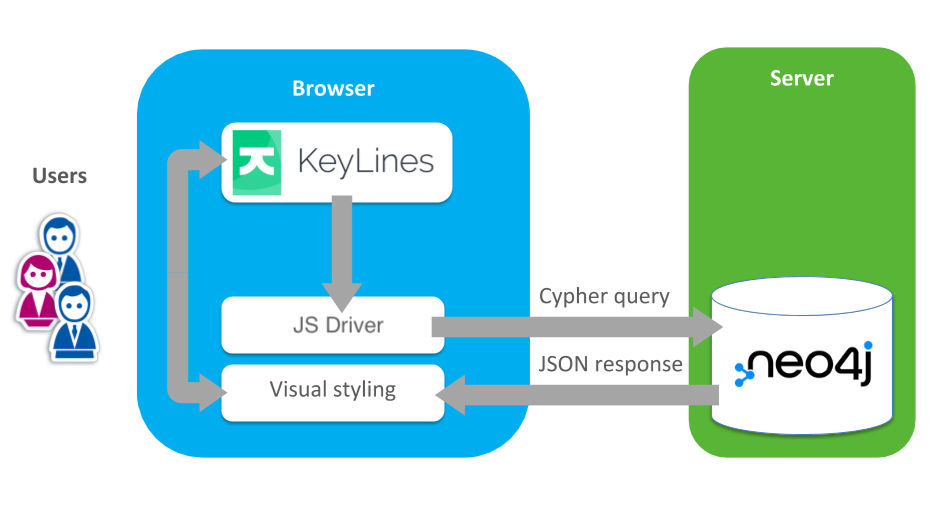
KeyLines runs entirely in the web browser. The controller generates Cypher queries as the user interacts with the nodes and links in their chart. Neo4j then sends the new data back as a JSON object to KeyLines, which is styled and presented in the browser.
The KeyLines SDK includes sample data showing how to get this up and running. You can also find additional information in our Neo4j & KeyLines integration tutorial.
Integrating Neo4j with the KeyLines time bar
To visualize our dynamic Neo4j graphs in KeyLines, we’ll need to:
- Load time-stamped data into Neo4j
- Create a client-side web application
- Send Cypher queries to our Neo4j database
- Parse the response into KeyLines’ JSON
- Load the Neo4j time series data
- Add time bar interactivity
Step 1: Load time series data into Neo4j
Natively, Neo4j doesn’t have any date or time formats on properties or in the Cypher query language. It’s fairly easy to get around this limitation, however, by storing time as a standard property on the node or relationships, usually as a UNIX integer timestamp:
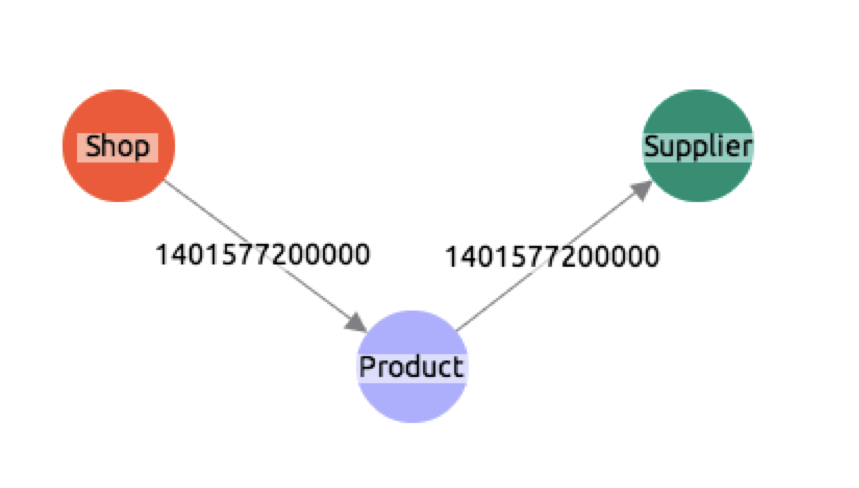
We’ve taken a sample dataset, created by Data and Analytics Specialist, Ian Robinson, which shows relationships in a simple supply chain.
Running the command into Neo4j will create nodes for products, shops and suppliers and the relationships between them (sells and supplied_by):
CREATE
(s1:Shop{id:'s1',type:'Shop',name:'General Store'}),
(p1:Product{id:'p1',type:'Product',name:'Cheese'}),
(p2:Product{id:'p2',type:'Product',name:'Crisps'}),
(p3:Product{id:'p3',type:'Product',name:'Orange Juice'}),
(p4:Product{id:'p4',type:'Product',name:'Apples'}),
(p5:Product{id:'p5',type:'Product',name:'Bread'}),
(u1:Supplier{id:'u1',type:'Supplier',name:'International Imports'}),
(u2:Supplier{id:'u2',type:'Supplier',name:'Local Markets'}),
(s2:Shop{id:'s2',type:'Shop',name:'Cornershop'}),
(s1)-[:SELLS{from:1396306800000}]->(p1),
(s1)-[:SELLS{from:1396306800000}]->(p2),
(s2)-[:SELLS{from:1396306800000}]->(p3),
(s2)-[:SELLS{from:1398898800000}]->(p4),
(s1)-[:SELLS{from:1401577200000}]->(p5),
(p1)-[:SUPPLIED_BY{from:1388534400000}]->(u2),
(p2)-[:SUPPLIED_BY{from:1391212800000}]->(u1),
(p3)-[:SUPPLIED_BY{from:1393632000000}]->(u2),
(p4)-[:SUPPLIED_BY{from:1393632000000}]->(u1),
(p5)-[:SUPPLIED_BY{from:1393632000000}]->(u2)
One thing to mention about our data structure here is that we’ve chosen only to add timestamp information to the relationships, not on the nodes themselves. You could also add them to nodes (or even create a time-tree with time-specific nodes in Neo4j), but we have chosen to do this so we can see the relationships changing over time.
Step 2: Create a client-side web application
For full instructions on how to do this, see our Neo4j & KeyLines integration tutorial, or use the sample code in the KeyLines SDK. If you don’t have KeyLines yet, go ahead and request a free KeyLines trial.
Step 3: Send Cypher queries to our Neo4j database
Now we have data in our Neo4j database, we can start raising our AJAX Cypher queries to retrieve it into KeyLines. To make life easier, let’s create a function to send AJAX requests to the cypher endpoint:
  function sendQuery (query, callback) {
  $.ajax({
    type: 'POST',
    // This is the url of the cypher end point.
    url:'http://localhost:7474/db/data/cypher',
    // send the data with the params approach to avoid Cypher injections
    data: JSON.stringify({query: query}),
    dataType: 'json',
    contentType: 'application/json',
    // map to our callback method, first parameter will be json result from neo4j
    success: callback,
    error: function (xhr) {
      console.log(xhr);
    }
  });
}
There are two things happening here:
- ‘sendQuery’ accepts a query parameter, which is the full string of the Cypher query we want to run
- a callback function is called with a JSON response from our Neo4j Cypher endpoint
To start our application, let’s load the nodes:
  sendQuery('MATCH (n) RETURN DISTINCT n.type, n.name, n.id;', function (json) {
  makeNodes(json.data)
});
Step 4: Parse the response into KeyLines’ JSON
The Neo4j database returns an array in which each item is itself an array in the requested order.
So, json.data[0] will be an array of length 3, with Type, Name and ID, in that order.
The ‘makeNodes’ function is all that’s required to parse from Neo4j’s JSON format to KeyLines own JSON format:
  function makeNodes(nodes) {
  return _.map(nodes, function (node) {
    return {
      type: 'node',
      id: node[2],
      d: {
        type: node[0]
      },
      c: getColour(node[0]),
      t: node[1]
    };
  });
}

function getColour (type) {
  type = type.toLowerCase();
  if (type === 'shop') {
    return 'blue';
  } else if (type === 'product') {
    return 'red';
  }
  return 'green';
}
We’ve also asked for the nodes to have a color, based on their type. We’ve used Underscore for a cross-browser compatible map function.
Step 5: Load the Neo4j time series data
With this next bit of code, we’re going to load relationships for a specific Neo4j time series into both the KeyLines chart and the KeyLines time bar.
The ‘loadLinks’ function means we can query Neo4j to return results from any time period:
// ensure we have unique IDs
var linkId = 0;
function loadLinks(from, to) {
  sendQuery('MATCH (a)-[r]->(b) WHERE r.from >= ' + from + ' AND r.from < ' + to + ' RETURN a.id, b.id, type(r), r.from;', function (json) {
    var result = _.map(json.data, function (link) {
      return {
        id: 'link' + linkId++,
        id1: link[0],
        id2: link[1],
        t: link[2],
        type: 'link',
        a2: true,
        dt: [link[3]]
      };
    });
    chart.merge(result);
    timebar.merge(result);
  });
}
So, our initial application call to load the nodes and some relationships in a given time period looks like this:
  sendQuery('MATCH (n) RETURN DISTINCT n.type, n.name, n.id;', function (json) {
    // turn response into KeyLines nodes format
    var nodes = makeNodes(json.data)
    // Now load links for an arbitrary date period
    loadLinks(new Date(2014, 0, 1).getTime(), new Date(2014, 3, 1).getTime(), function (links) {
      // load and layout all the nodes and links into the chart
      chart.load({type: 'LinkChart', items: nodes.concat(links)}, chart.layout);
      // merge in only the links into the time bar (as these are the only items with date properties)
      timebar.merge(links, function () {
        timebar.zoom('fit');
      });
    });
  });
Which gives us this visualization:
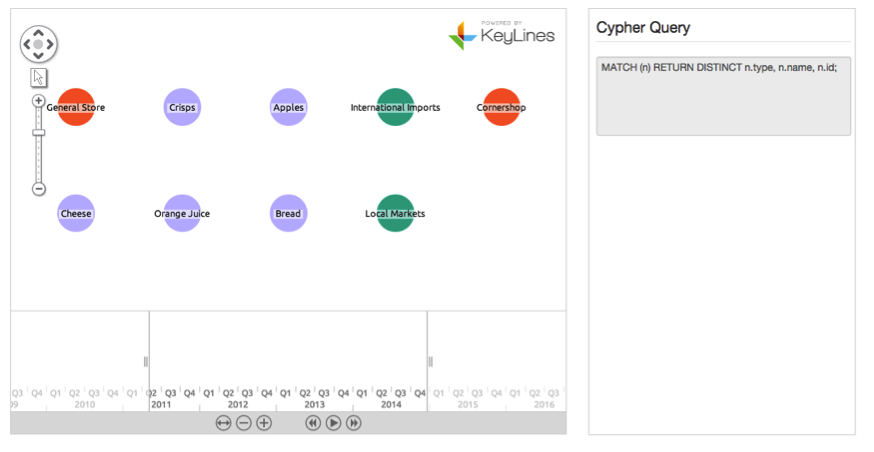
Step 6: Add some time bar interactivity
We’re nearly there. We have a working KeyLines visualization, calling data from our loaded Neo4j database, using Cypher.
Now let’s add some user interaction. It’s easy to bind functionality to the time bar ‘change’ event. When the user extends the time bar range, it’ll query the Neo4j database and new data will be merged in.
Let’s bind a function to the time bar ‘change’ event:
// using underscore’s debounce method so that we only hook onto change events every 400ms
timebar.on('change', _.debounce(function () {
    // filter the chart to show only items in the new range
    chart.filter(function (item) {
      if (item.type === 'link') {
        return timebar.inRange(item);
      }
      // but always show all nodes
      return true;
    }, { animate: false, type: 'all' }, function() {
      // and then adjust the chart's layout
      chart.layout('standard', { animate: true, time: 1000 });
    });
    var range = timebar.range();
// if the user has extended the date range into the future we will send a request for more data for this date range
    if (range.dt2.getTime() > endDate) {
      loadLinks(endDate, range.dt2.getTime(), function (links) {
        chart.merge(links);
        timebar.merge(links);
      });
    }
  }, 400));
This function is doing a few important things here.
It filters the chart to only show links with a date property inside the current time bar range, then it checks to see if the new date range goes further into the future than the previous range (stored somewhere else in the code as ‘endDate’). If it does then it uses our loadLinks function to merge in new links for this new date period.
Success!
And with that, we’re done. Our application is communicating with Neo4j, loading the time series data into KeyLines and responding to user interaction in the time bar.
What next?
Creating a powerful, custom-designed Neo4j visualization is easy with our toolkit technology. If you haven’t signed up to try our technology already, request a free trial.
Share: