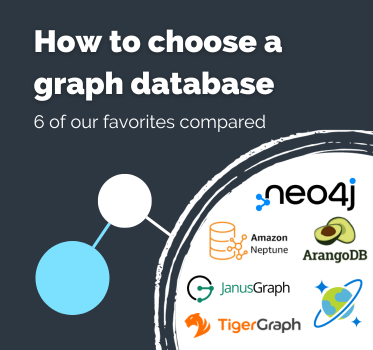
How to choose a graph database: We compare 8 favorites
Rosy Hunt Content Marketing Specialist
26th October, 2025 | 13 min read
If you’ve found this article, the chances are you: Need to build a powerful graph or graph analytics application...
Rosy Hunt Content Marketing Specialist
26th October, 2025 | 13 min read
If you’ve found this article, the chances are you: Need to build a powerful graph or graph analytics application...
Ryan Shimmon Commercial Software Developer
5th October, 2025 | 9 min read
To build a high-performance, scalable graph visualization application, you need a reliable way to store and query...
Corey Lanum Chief Product Evangelist
14th November, 2023 | 15 min read
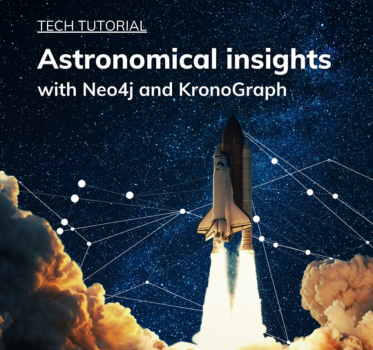
In this tutorial, you’ll find out how to use Neo4j and KronoGraph to create an interactive timeline...
Corey Lanum Chief Product Evangelist
4th April, 2023 | 14 min read
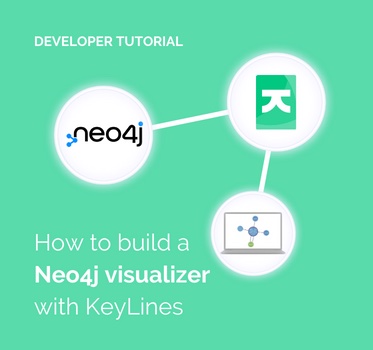
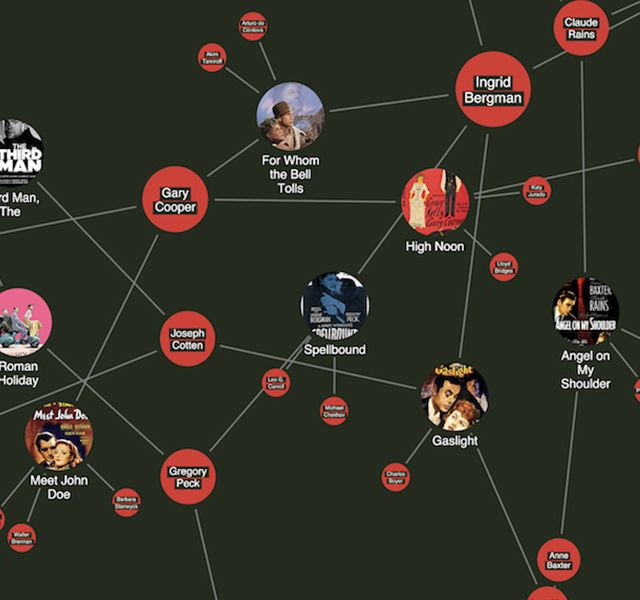
In this tutorial for JavaScript developers, I’ll demonstrate how to build a Neo4j visualizer with our graph...
Sonali Singh Solutions Engineer
27th April, 2021 | 8 min read
Learn how to use the Neo4j Bolt Protocol to visualize Neo4j graph databases with the KeyLines graph visualization...
Matt Michel Developer
6th April, 2021 | 8 min read
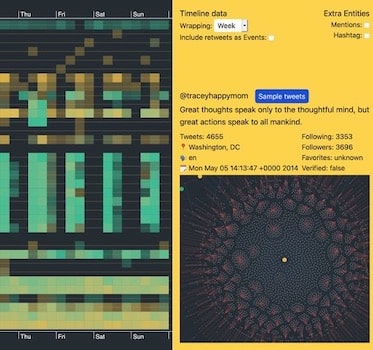
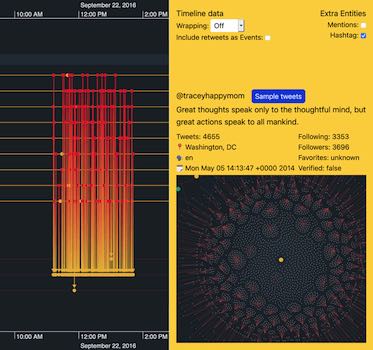
Let’s use KronoGraph and ReGraph to dig deeper into a Twitter data visualization to find patterns of...
Matt Michel Developer
3rd March, 2021 | 8 min read
Create an interactive React application where Neo4j timeline visualization and graph visualization work...
Christian Miles VP of Sales
21st October, 2019 | 9 min read
We show how quickly and easily you can use GRANDstack and ReGraph to create powerful React Neo4j visualization...
Dan Williams Chief Product Officer
17th October, 2018 | 7 min read
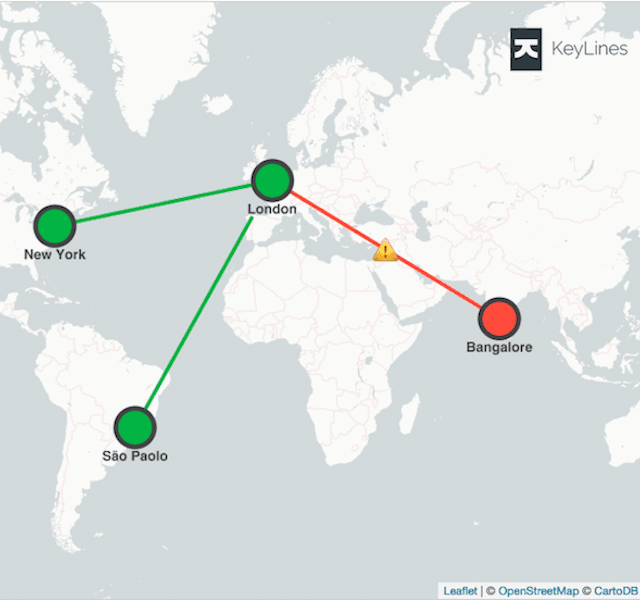
With KeyLines and Neo4j graph database integrations, exploiting geospatial data has never been easier. Discover...
Registered in England and Wales with Company Number 07625370 | VAT Number 113 1740 61
6-8 Hills Road, Cambridge, CB2 1JP. All material © Cambridge Intelligence .
Privacy Policy | Security Framework
