
This tutorial relies on earlier versions of third-party tools – later versions may not work as expected. For an alternative React tutorial, see: Neo4j visualization with ReGraph
Many Cambridge Intelligence customers love building Neo4j graph visualizations. It’s by far the most popular graph database integration for organizations using our toolkits to create efficient, easily-maintained graph visualization applications.
In this blog post, I’ll show how quickly and easily you can use ReGraph, our graph visualization toolkit for React developers, and GRANDstack to build a React Neo4j visualization application. It contains all the code from my talk at NODES 19, Neo4j’s online developer summit (watch it on YouTube). We’ll also use datasets featuring movies and the FIFA Women’s World Cup to showcase some of the things you can achieve with your charts.
I also blogged about building a Neo4j graph and timeline visualization app that drives fraud investigations and an application to pull data efficiently from the GitHub API, using Neo4j and the other premium tools in GRANDstack such as the Facebook-backed query language, GraphQL.
GraphQL was a relatively new tool back then, but a lot has changed since. Modern developer tools for building full-stack applications have improved substantially, and Neo4j promote the best of them under their GRANDstack banner.
If you want to follow a pure JavaScript version of this tutorial instead, see How to build a Neo4j visualizer with KeyLines.
Integrate your React component with Neo4j
One way to get started is to use the grand-stack-starter repository from Neo4j. This simple starter project provides all the tools you need to build an application.
But for this blog post, we’ll build our front and back end “from scratch” to show how easy it is.
Such is the nature of web development today, “from scratch” actually means we’ll be leveraging some excellent open-source libraries. This takes away complexity, making it much easier to build applications.
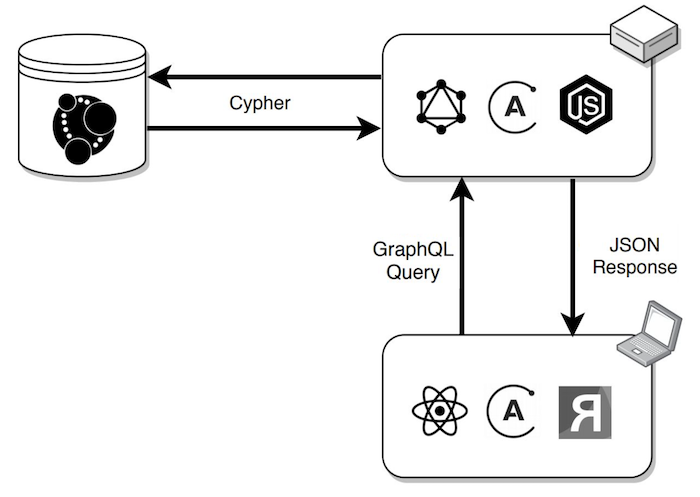
Here’s the basic architecture we’re building. When our ReGraph application issues a GraphQL query, the GraphQL API sends a Cypher query to Neo4j via the Bolt protocol. The JSON response is sent to ReGraph where it updates the React props and the graph visualization.
Create a ReGraph application
Let’s start with the front end. We’ll create a basic React application that we can adapt to use a GraphQL endpoint. create-react-app from Facebook provides all the boilerplate we need.
npx create-react-app grandstack-regraph-app
cd grandstack-regraph-app
Now we’ll download the latest version of ReGraph and add it to the new React application. If you don’t have access already, just request a free ReGraph trial.
Let’s add ReGraph as a dependency:
cp ~/Downloads/regraph-1.5.0.tgz .
yarn add file:regraph-1.5.0.tgz
Now we’ll create our first chart, with a few small alterations to App.js:
import React from 'react';
import { Chart } from 'regraph';

import './App.css';

function App() {
  return (
    <div style={{ display: 'flex', width: '100vw', height: '100vh' }}>
      <Chart
        items={{ node: { label: { text: 'Welcome to ReGraph!' } } }}
        options={{}}
      />
    </div>
  );
}

export default App;
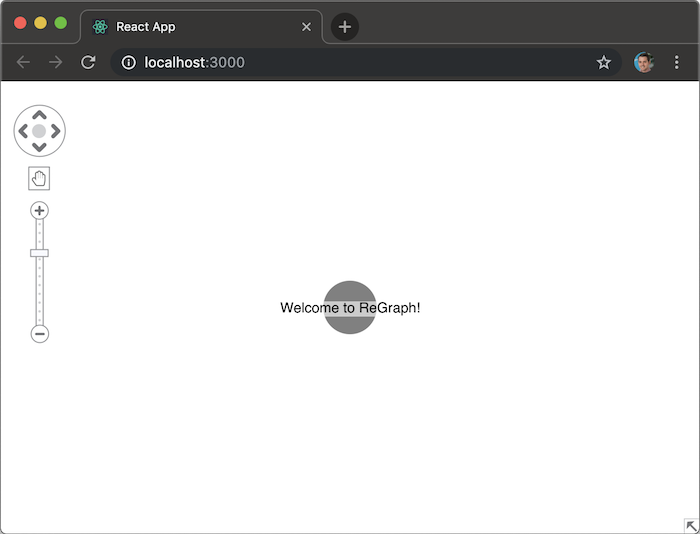
With minimal effort, we already have our first ReGraph application with a single node in the center of the screen.
Want to build your own React Neo4j visualization?
Configure the server-side API
Now for the back end. Let’s configure Apollo to create GraphQL workflows that’ll enable us to query our Neo4j database.
mkdir graphql-server-example
cd graphql-server-example
yarn init --yes
yarn add apollo-server neo4j-graphql-js dotenv
The .env file defines the Neo4j connection details. Here we’re using a Neo4j dataset featuring the FIFA Women’s World Cup 2019:
NEO4J_URI=bolt://5d37db5a.databases.neo4j.io:7687
NEO4J_USER=worldcup
NEO4J_PASSWORD=worldcup
Apollo Server also comes with GraphQL Playground – its own graphical, interactive GraphQL IDE. To configure the Apollo Server in the index.js file, use:
const { ApolloServer, gql } = require('apollo-server');

const neo4j = require('neo4j-driver').v1;
const { makeAugmentedSchema, inferSchema } = require('neo4j-graphql-js');

const dotenv = require('dotenv');
dotenv.config();

const driver = neo4j.driver(
  process.env.NEO4J_URI,
  neo4j.auth.basic(process.env.NEO4J_USER, process.env.NEO4J_PASSWORD)
);
const context = { driver };

inferSchema(driver).then(({ typeDefs }) => {
  const schema = makeAugmentedSchema({ typeDefs });
  const server = new ApolloServer({ context, schema });

  server.listen().then(({ url }) => {
    console.log(`   Server ready at ${url}`);
  });
});


npx nodemon index.js
Now you can explore GraphQL in its own intuitive GUI.
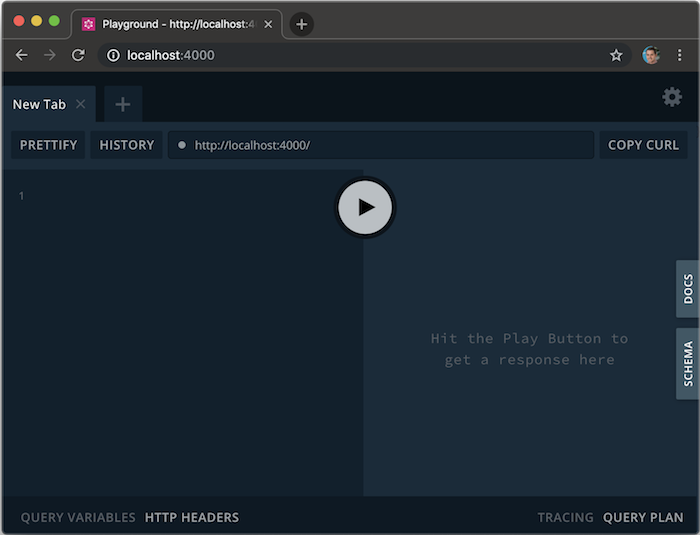
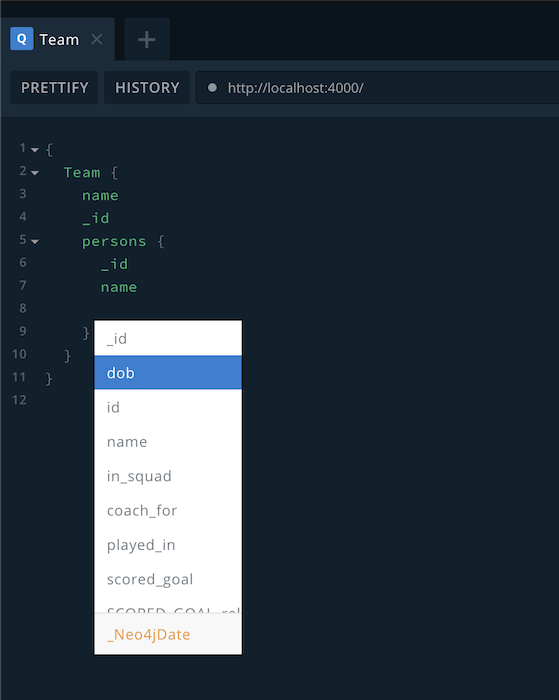
GraphQL endpoints are effectively self-documenting, we can use the hints in the browser to quickly and easily build queries against our endpoints.
If we write a query against our World Cup Neo4j instance, we can see the help it offers:
Now we have a GraphQL endpoint deployed that reads the schema directly from our Neo4j instance. Let’s go back to our application and glue it together with ReGraph.
Connecting the front and back ends
We have a number of dependencies to add to our application. At the terminal, enter:
yarn add graphql apollo-boost @apollo/react-hooks
Now add the Apollo client to our base index.js file. First we import:
import ApolloClient from 'apollo-boost';
import { ApolloProvider } from '@apollo/react-hooks';
Then we update our base render statement with our imported Client:
const client = new ApolloClient({ uri: 'https://movies.grandstack.io' });

ReactDOM.render(
  <ApolloProvider client={client}>
    <App />
  </ApolloProvider>
  document.getElementById('root')
);
This gives our entire app access to the client for queries. To do this, we turn to App.js and import similar functions:
import { useQuery } from '@apollo/react-hooks';
import { gql } from 'apollo-boost';
Importing the gql function and using it as a modern JavaScript “tag” lets us define our GraphQL queries in a consistent, helpful way. With modern text editors, it provides syntax highlighting and query string formatting for free.
Using React Hooks
React Hooks make it really simple to add querying to our Neo4j visualization application.
First, let’s define our query. We’ll query the “Movies” example that’s already built into Neo4j Browser. We just need to use the existing Movies endpoint and update our App function from earlier:
function App() {
  const { loading, error, data } = useQuery(gql`
    {
      Movie(
        filter: { AND: [{ year_gt: 1920 }, { year_lt: 1939 }] }
        first: 100
      ) {
        _id
        title
        image: poster
        actors {
          _id
          name
        }
      }
    }
  `);

  if (loading) return <p>Loading...</p>;
  if (error) return <p>Error!</>;

  const items = createItems(data);

  return (
    <div style={{ display: 'flex', width: '100vw', height: '100vh' }}>
      <Chart items={items} options={options} layout={{ name: 'organic' }} />
    </div>
  );
}
We use a function called createItems here that maps the result from our GraphQL endpoint to the simple format expected by ReGraph. This is trivial due to the strong type system of GraphQL: each nested result has a __typename property and we can get unique _id properties as part of our query.
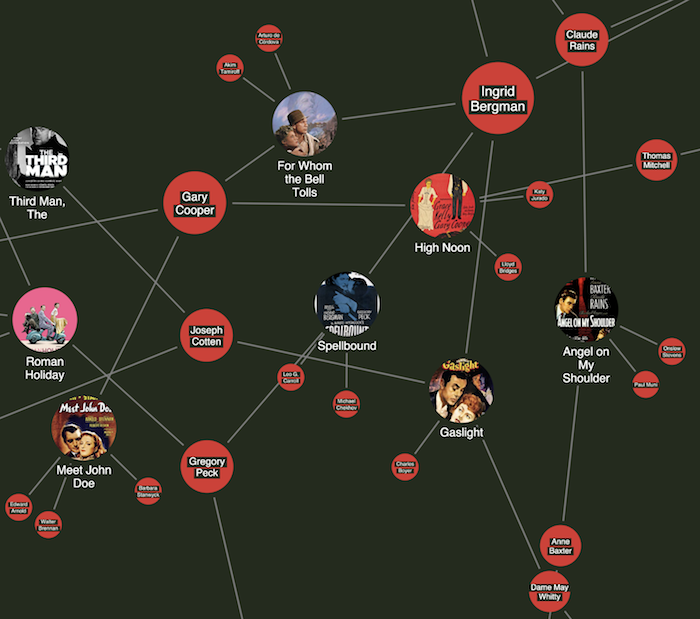
With a bit of polishing, we get a nice graph of our Movie dataset.
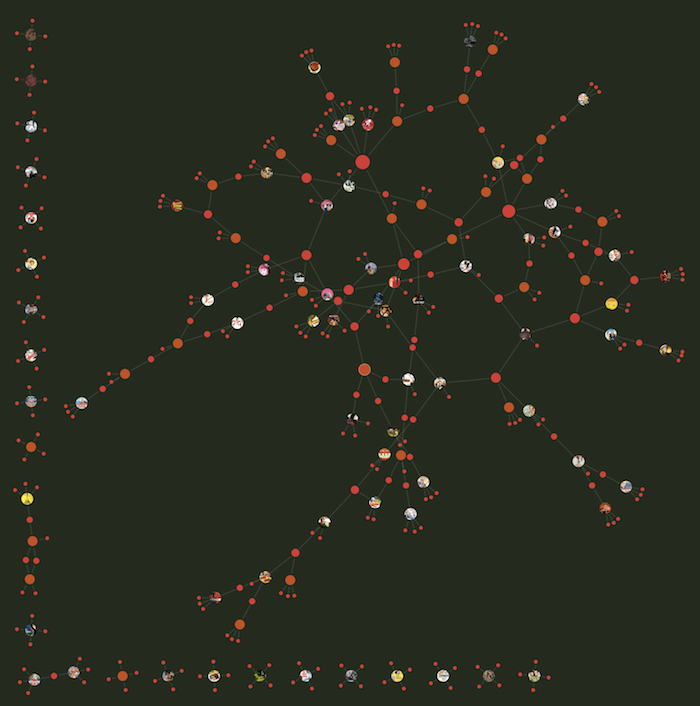
Almost every aspect of our React Neo4j visualization can be customized to suit your preferred style. We’ve used the movie poster URLs and set them as images for nodes.
Revealing insight with React Neo4j visualizations
With our application built, we can start making sense of the connections in our data. ReGraph is full of advanced features and functions to bring that data to life.
Part of the power of our new application is that it doesn’t take much to apply the same code to a different database. Let’s switch back to our Women’s World Cup dataset to look at previous tournaments and the players that took part.
Here the GraphQL query is:
  {
    Person {
      _id
      name
      dob {
        formatted
      }
      in_squad {
        _id
      }
    }
    Squad {
      _id
      name: id
    }
  }
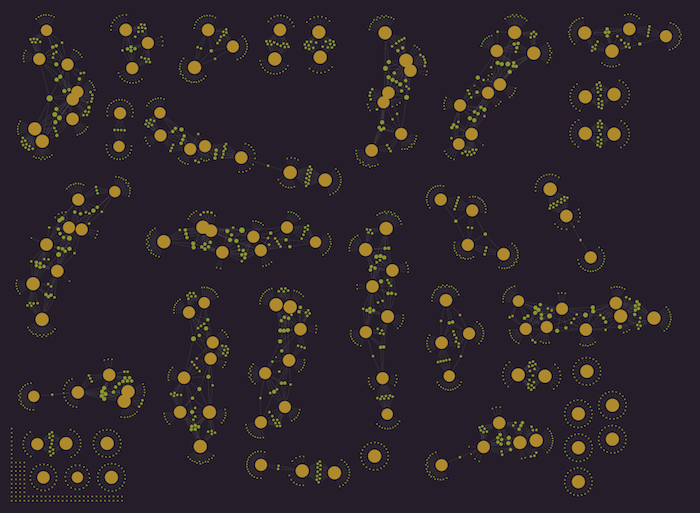
Each component features yellow nodes representing the number of World Cup tournaments that country has taken part in. The associated smaller green nodes are the players included in those squads.
This view gives us a nice overview – you can clearly see those countries who’ve been in multiple tournaments and those who’ve made only one appearance.
Let’s zoom in to look at Brazil. Their women’s team have taken part in all eight World Cup tournaments so far. Using ReGraph’s social network analysis (SNA) centrality measures, we can size individual players according to the number of finals they’ve played in over the years.
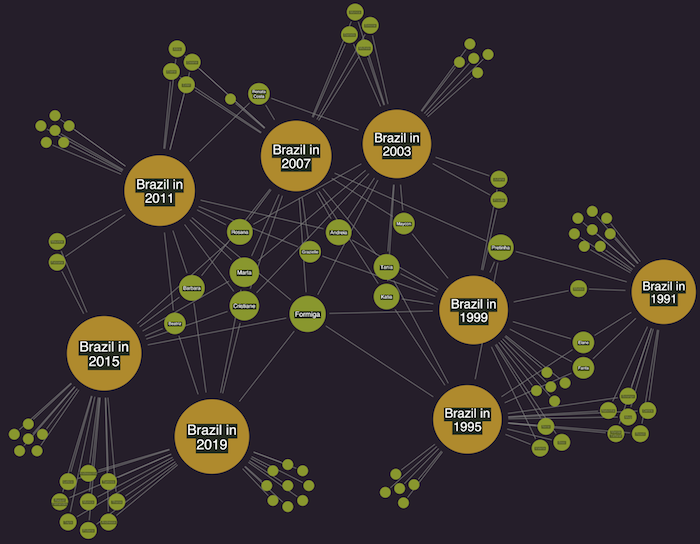
We can quite clearly see Formiga’s played in a record-breaking seven tournaments.
Try our technology
GRANDstack is a rich ecosystem of tools that developers use to rapidly build and prototype graph applications. We’ve shown how easy it is to add React Neo4j graph visualizations using our flexible, powerful ReGraph toolkit.
Want to learn more? We’ve also written about visualizing Twitter with React & GraphQL.
ReGraph trials are free. Simply sign up here to get started.
Share:
