
Visualizing big data requires careful planning. When the data store contains live data that’s constantly changing, you need a solution that can handle both size and speed.
Our data visualization technology can manage your largest dynamic datasets, but there’s little insight to be found in a chart that contains an overwhelming mass of entities and links. The smart approach is to analyze key items first, then update or add data as the depth or scope of analysis widens.
ReGraph, our ReactJS graph visualization toolkit, comes with advanced demos that showcase what you can achieve in your applications. One of the most popular demos features an integration with the Twitter API. It easily loads tweets, hashtags and users in realtime from the billions available.
This blog post is a step-by-step developer guide to integrating your ReGraph visualization app with live Twitter data. By the end you’ll have your own working ReactJS graph visualization app that loads hashtags, tweets and Twitter user details. We’ll also explore key features of ReGraph that give analysts the best user experience. Let’s get to it.
Getting started: tools & the data model
We’ll create a basic ReactJS application, add ReGraph to it and query the Twitter API using GraphQLHub, created by Clay Allsopp. This open source project provides GraphQL endpoints for popular APIs including Reddit, GitHub and Giphy.
We’ll also use the Apollo Client to fetch and manage our GraphQL data. It’s an easy way to work with GraphQL endpoints, and offers a great solution for loading and storing data in your ReGraph application. You’ll see Yarn commands throughout the tutorial, but you can use whatever CLI you prefer.
You’ll need ReGraph for this tutorial
Not using ReGraph yet?
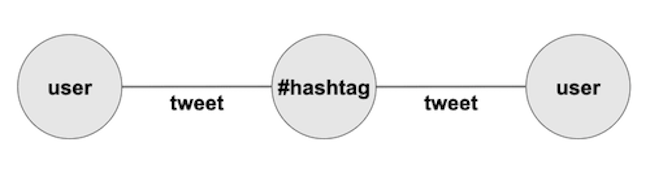
For our data model, we’ll use a simplified version of the ReGraph Twitter demo’s schema:
- Nodes represent hashtags and Twitter users
- Links are tweets between users, or tweets from a user that includes a hashtag
We’ll think about styling options later. First, let’s create our application.
Step 1: Bootstrapping a ReactJS application
To start, we’ll create an empty ReactJS application using Facebook’s create-react-app command:
yarn create react-app twitter-demo
cd twitter-demo
Next, we’ll include the latest version of ReGraph, our graph visualization toolkit for React, downloaded from the ReGraph SDK site:
cp ~/Downloads/regraph.tgz .
yarn add file:regraph.tgz
Let’s add Apollo Client package and GraphQL package that’ll manage our interactions with the Twitter API:
yarn add @apollo/client graphql
Finally, we’ll update App.js to create our first visualization:
import React from "react";
import { Chart } from "regraph";
function App() {
return (
<div style={{ width: "100vw", height: "100vh" }}>
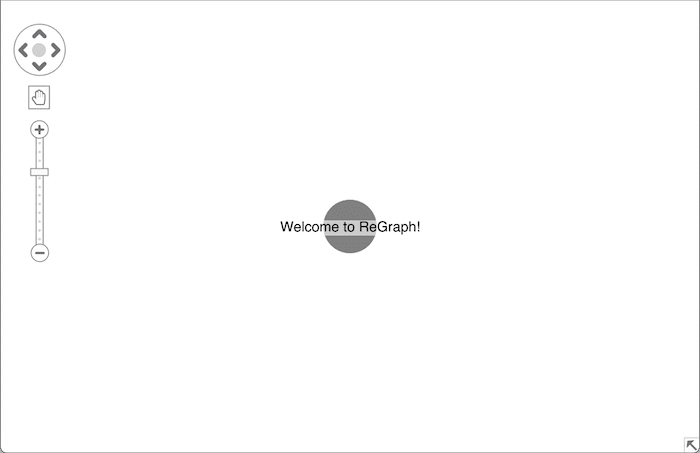
<Chart items={{ node: { label: { text: “Welcome to ReGraph!” } } }} />
</div>
);
}
export default App;
That’s all the code you need to build your ReGraph application. We can start it to see the first version of our ReGraph Twitter API integration demo:
Step 2: Set up GraphQLHub
You’ll need a Twitter API key before completing this next step. You can apply for a key here.
Next install GraphQLHub, which is a thin wrapper on top of the Twitter API. For this, you’ll need to have Node and Git installed on your system. GraphQLHub doesn’t work with Yarn, so you’ll also need to have npm available.
Follow GraphQLHub’s quick start instructions.
While creating your env file, you’ll need to insert the Twitter API key and twitter api secret. Open the .env file you just created and replace the XXX in these lines with your key and secret.
TWITTER_CONSUMER_KEY=XXX
TWITTER_CONSUMER_SECRET=XXX
You do not need any other API keys for GraphQLHub to run, however you’ll only be able to interact with twitter data if you don’t specify any of the other keys.
Once you’ve completed the quick start instruction, your local GraphQLHub should be available on your machine at http://localhost:3000.
Step 3: Configuring the Apollo Client
We need to set up the Apollo Client to use the GraphQLHub endpoint so we can query our Twitter API.
To configure this, we’ll replace the contents of the index.js file with:
import { ApolloClient, ApolloProvider, InMemoryCache } from "@apollo/client";
import React from "react";
import ReactDOM from "react-dom";
import "./index.css";
import App from "./App";

const client = new ApolloClient({
  uri: "http://localhost:3000/graphql",
  cache: new InMemoryCache()
});


ReactDOM.render(
  <React.StrictMode>
    <ApolloProvider client={client}>
      <App />
    </ApolloProvider>
  </React.StrictMode>,
  document.getElementById("root")
);
Step 4: Querying the Twitter API with GraphQLHub
Let’s think about the query that GraphQLHub can use to populate our ReactJS graph visualization.
GraphQLHub provides three fields we can use to query the Twitter API: user, tweet and search.
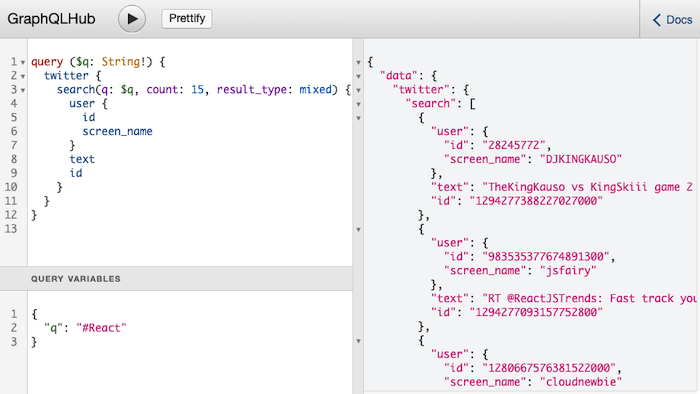
We’ll define a query that looks up 15 tweets together with:
- the unique ID of each tweet
- the text contained in each tweet
- the names and unique IDs of the users who tweeted
query($q: String!) {
  twitter {
    search(q: $q, count: 15, result_type: mixed) {
      id
      text
      user {
        id
        screen_name
      }
    }
  }
}
We can copy our query into the GraphQLHub/PlayGround to see what data is returned:
In the next step, we’ll add this query to our App.js file along with other code changes.
Step 5: Loading data from the Twitter API
There are just a few things left to do before we can visualize our Twitter data. We need to:
- Import the useQuery-hook, which we’ll use to send a GraphQL query to the API endpoint.
- Import the gql function, which we’ll use to define our query.
- Define functions that convert the data format returned from the endpoint into the format ReGraph understands.
- Execute the query when our application starts and transform the returned data using the function we defined.
To make life easier, we’ve written code that covers all of these actions. Simply replace the existing code inside App.js with this:
import { useQuery, gql } from "@apollo/client";
import React from "react";
import { Chart } from "regraph";

const TWEETS_WITH_HASHTAG = gql`
  query($q: String!) {
    twitter {
      search(q: $q, count: 15, result_type: mixed) {
        id
        text
        user {
          id
          screen_name
        }
      }
    }
  }
`;


/**
 * Create a ReGraph node object from a Twitter API user
 */
function createUserNode(user) {
  return {
    label: { text: user.screen_name };
  };
}

/**
 * Create a ReGraph node object from a hashtag
 */
function createHashtagNode(hashtag) {
  return {
    label: { text: hashtag };
  };
}

/**
 * Create a ReGraph items object from a Twitter API response for a search for
 * a hashtag.
 */
function toReGraphFormat(data) {
  // The data for the `search` field returned from the API is nested inside the
  // property twitter.
  const { search } = data.twitter;

  // We iterate through all tweets and add a node for the user that tweeted and
  // a link between the user node and hashtag used. Any hashtags used will also
  // be added to the chart
  const items = {};
  for (const tweet of search) {
    const { id, user, text } = tweet;
    items[`user_${user.id}`] = createUserNode(user);

    // Find all used hashtags inside the tweet
    const usedHashtags = text.match(/#w+/g);

    // Add all new hashtags and a link to the items if there are any
    if (usedHashtags != null) {
      // We lower case the found hashtags to prevent duplicate nodes like
      // "#javascript" and "#JavaScript"
      const hashtags = usedHashtags.map(hashtag => hashtag.toLowerCase());
      for (const hashtag of hashtags) {
        if (items[`hashtag_${hashtag}`] == null) {
          items[`hashtag_${hashtag}`] = createHashtagNode(hashtag);
        }
        items[`tweet_${id}_${hashtag}`] = {
          id1: `user_${user.id}`,
          id2: `hashtag_${hashtag}`
        };
      }
    }
  }

  return items;
}

const START_HASHTAG = "#javascript";

const DEFAULT_ITEMS = {
  [`hashtag_${START_HASHTAG}`]: {
    label: { text: START_HASHTAG }
  }
};

function App() {
  // Execute the query via Apollo Client
  const { error, data } = useQuery(TWEETS_WITH_HASHTAG, {
    variables: { q: START_HASHTAG }
  });

  if (error) {
    return `Error! ${error}`;
  }

  const items =
    data == null || Object.keys(data).length === 0
      ? DEFAULT_ITEMS
      : toReGraphFormat(data);

  return (
    <div style={{ width: "100vw", height: "100vh" }}>
      <Chart items={items} />
    </div>
  );
}

export default App;
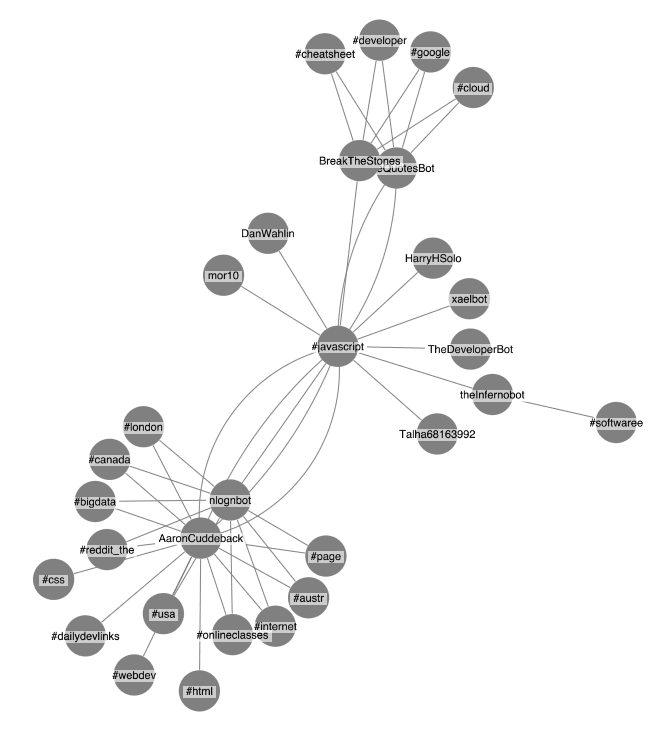
We’ve done it. Now we can use ReGraph to visualize 15 tweets associated with #javascript, together with related Twitter hashtags, tweets and users.
Want to learn more about how to harness Hooks in your React code? Check our blog post discussing React Hooks.
Step 6: Defining interactions to load data dynamically
One powerful interactive feature of ReGraph is its ability to load live data on the fly. Analysts don’t need to visualize everything at once: they want to focus on the key data but have the power to expand the content on-demand.
ReGraph’s robust events engine lets you design every interaction to match your users’ workflows. Let’s add the ability to double-click on a hashtag node to load associated tweets and users.
First we need to update our code so it can tell the difference between nodes representing Twitter users and nodes representing hashtags. To do this, we’ll update our createUserNode and createHashtagNode functions by adding a data property to each node. The new property will store the node type (either hashtag or user) and a value (either the hashtag or the user’s ID).
The updated functions look like this:
function createUserNode(user) {
  return {
    label: { text: user.screen_name },
    data: { type: "user", value: user.id }
  };
}

function createHashtagNode(hashtag) {
  return {
    label: { text: hashtag },
    data: { type: "hashtag", value: hashtag }
  };
}
Next we’ll add the ability to double-click hashtag nodes using the onChartDoubleClick event handler. Inside the handler, we’ll check if the double-click was on a hashtag node and if so, we’ll query the Twitter API for more data.
To load additional data, we can rely on the useQuery-hook fetchMore function. We call fetchMore with the relevant hashtag and provide an updateQuery function that merges the new Twitter search results with the old search results.
Our update App-function looks like this:
function App() {
  // Execute the query via Apollo Client
  const { error, data, fetchMore } = useQuery(TWEETS_WITH_HASHTAG, {
    variables: { q: START_HASHTAG }
  });

  if (error) {
    return `Error! ${error}`;
  }

  const items =
    data == null || Object.keys(data).length === 0
      ? DEFAULT_ITEMS
      : toReGraphFormat(data);

  function handleChartDoubleClick(id) {
    // If no id is passed in the double click happened onto the background
    if (id == null) {
      return;
    }

    const item = items[id];
    // If the clicked on item has an `id1` property it was a link and we can
    // ignore it
    if (item.id1 != null) {
      return;
    }

    // Extract the data of the node into the `nodeData` variable
    const { data: nodeData } = item;
    const { type, value } = nodeData;

    if (type === "hashtag") {
      fetchMore({
        variables: { q: value },
        updateQuery(previousResult, { fetchMoreResult }) {
          if (fetchMoreResult == null) {
            return previousResult;
          }

          return {
            twitter: {
              ...previousResult.twitter,
              search: [
                ...previousResult.twitter.search,
                ...fetchMoreResult.twitter.search
              ]
            }
          };
        }
      });
    }
  }

  return (
    <div style={{ width: "100vw", height: "100vh" }}>
      <Chart items={items} onChartDoubleClick={handleChartDoubleClick} />
    </div>
  );
}
Now we can double-click any of the hashtag nodes to load additional data. Nice job.
ReGraph’s clever layout & viewport options
As we add data to the chart, notice how the network layout changes slightly to accommodate new nodes.
Components adapt automatically to changes around them using minimal movements, so users can keep track of their mental map of the visualization.
There’s also a ReGraph API option to automatically control how your chart fits items into the viewport. This makes sure users get to see every component in their chart without the need for manual adjustments.
Next steps: advanced styling & analysis
The visualization we’ve created in this tutorial looks pretty basic, but that’s intentional. You can choose from ReGraph’s many advanced styling options to create a chart that’s right for your end-user application. Here are a couple of examples.
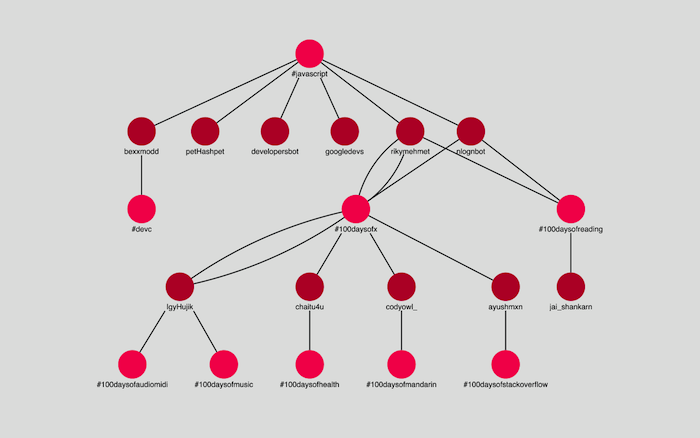
By applying ReGraph’s sequential graph layout to our data, we see a hierarchical view with the JavaScript hashtag at the top and the Twitter users below at different levels, depending on how often they’ve used that hashtag. It’s a good way to visualize data that flows from one level to another.
We’ve also used different shades of red for nodes at each tier to make them stand out.
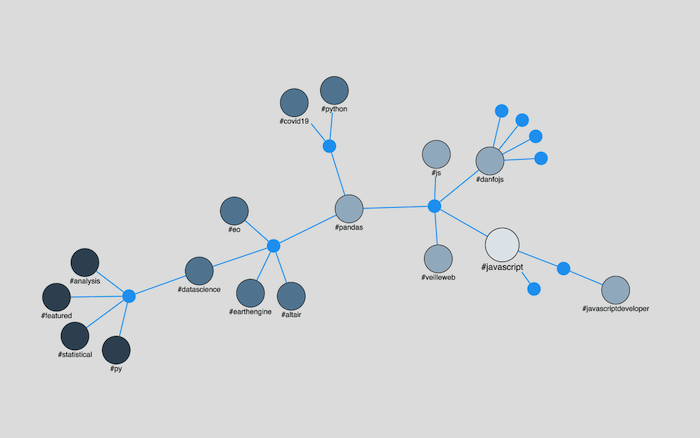
You could take advantage of ReGraph’s powerful graph analysis functions to understand the interactions between items in the network. We’ve used one here to calculate the distance – based on the number of links in the shortest path – between the #JavaScript node and every other node. We’ve also colored each hashtag node depending on that distance: nodes that are furthest away are darker gray.
You could also harness the power of a design library like React Material UI. In our React Material UI blog post, we demonstrate how easy it is to use the React Material UI design framework in ReGraph.
Start your ReGraph journey
Our Twitter demo is just one of the showcase examples available on the ReGraph SDK, together with a detailed Storybook, an interactive coding playground and comprehensive API documentation.
To integrate ReGraph with your API of choice, sign up to a free ReGraph trial.
Share:
