FREE: Start your ReGraph trial today
Visualize your data! Request full access to our ReGraph SDK, demos and live-coding playground.
In this React Material UI data visualization tutorial, I demonstrate how easy it is to use the React Material UI design framework in ReGraph – our React graph visualization toolkit – so you can develop a beautiful, stylish graph visualization application fast.
The most popular data visualization applications built using our toolkits don’t just reveal insight and uncover threats. They also stand out from the competition because they look good and are a joy to use.
Great application design doesn’t happen by accident. It takes skill and expertise, but if you harness the power of a design library like React Material UI, you’re off to a strong start.
You know that understanding and delivering what users want is key to good user experience (UX) design. You’ll also know that a key component of this is a user interface (UI) that features intuitive interactions, beautiful styling and instantly-recognizable icons.
So designing the world’s best React data visualization application is easy, right? Wrong.
There are many barriers to achieving a coherent and intuitive look and feel. Variations in browser behavior, unexpected formatting changes, and intricate layers of CSS overwriting one another can make this a real pain.
The best solution is to use a design system that makes sure your components work together. But to create one from scratch takes a lot of design, build and test resources. Few organizations are inclined to invest the time, expertise or funds for this. That’s what makes design packages like React Material UI so popular. Let’s take a closer look.

Material UI is the React implementation of Material Design, the web app design system created by Google. It’s a library of React components that act as a framework for a complete design system.
You can choose from a large array of pre-built, ready-to-ship React components, each designed as a template. They’re fully flexible: you can use them as they are, modify them, or even create your own from existing components. Each component is self-contained, so they’re not only easy to debug, but also simple to change without worrying about unexpected side-effects elsewhere in your app.
ReGraph users are already familiar with the flexible approach and the ability to customize almost every aspect of their graph visualization app. Designed for React, ReGraph is the perfect partner for Material UI components.
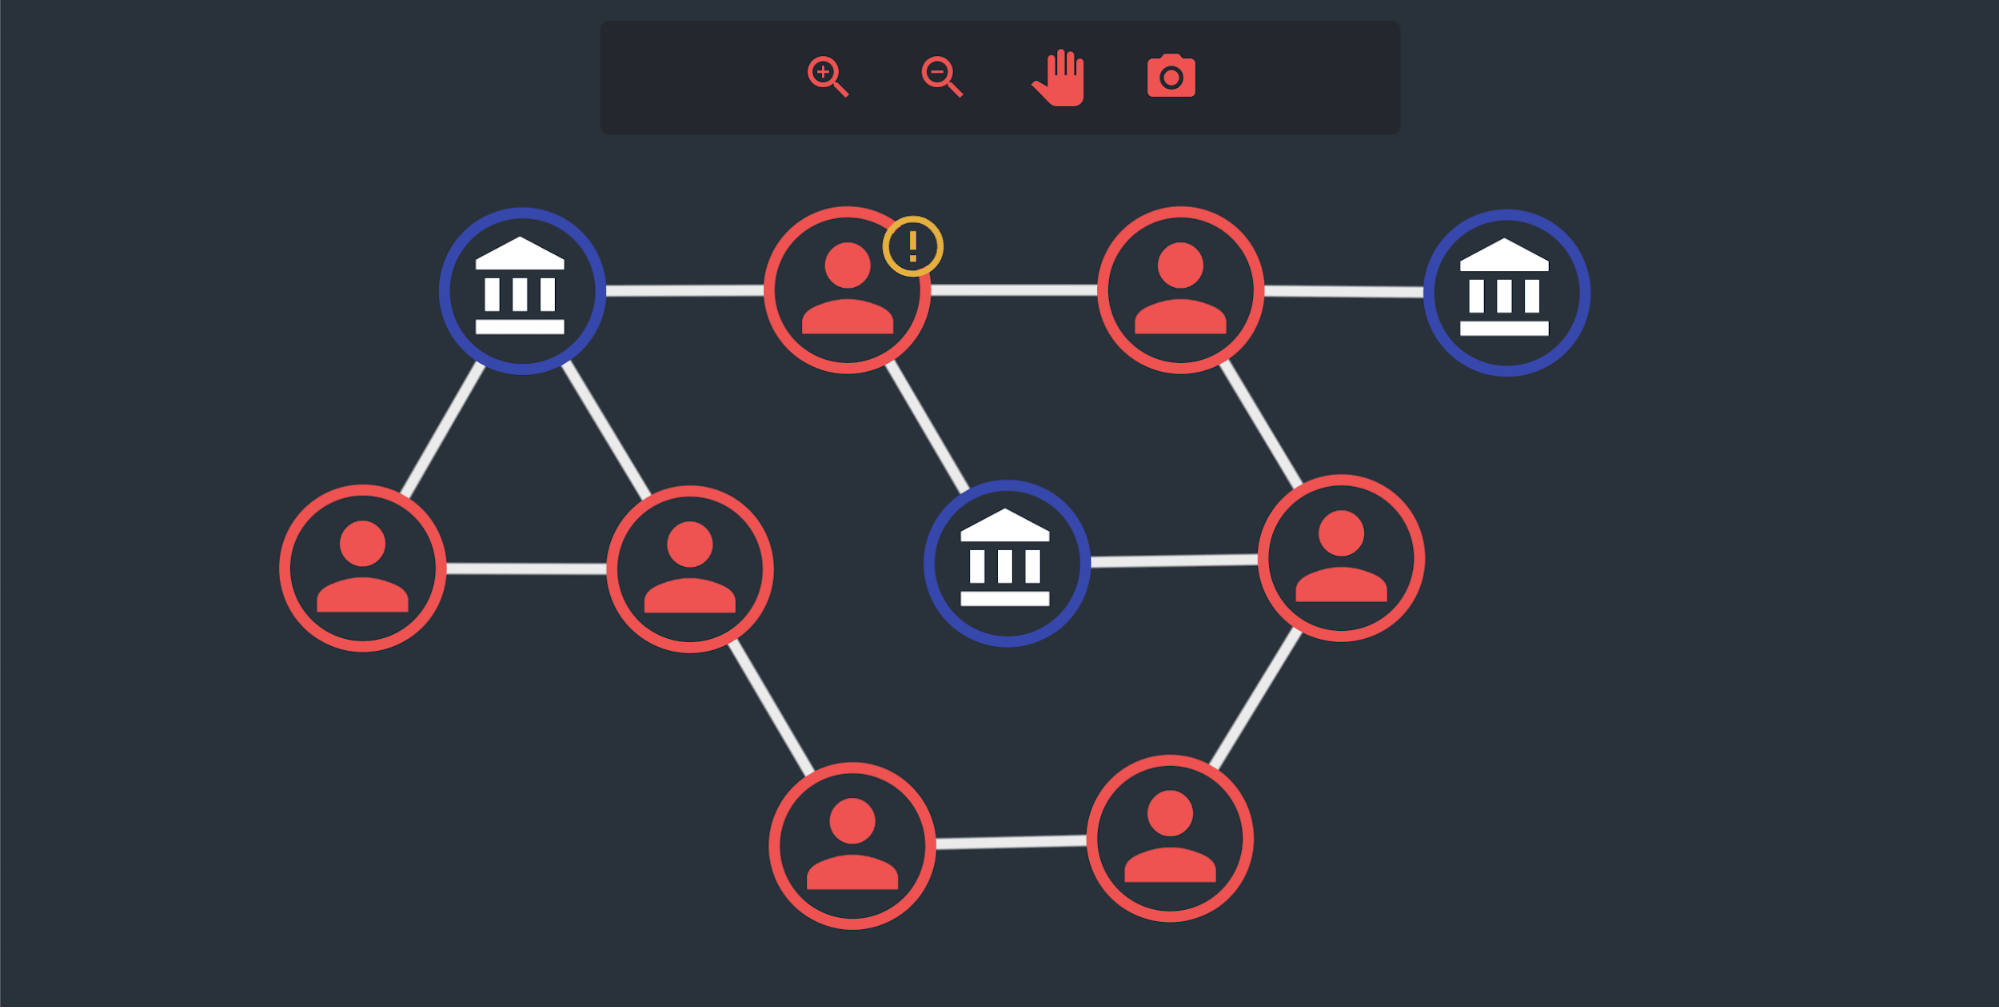
There are so many Material UI components to choose from, but we’ll keep things simple in our tutorial. Let’s replace the navigation controls in a ReGraph chart with our own custom toolbar.
First we need to pick our icons. As with all UX and UI design, it’s important to take a user-centric approach. Find out which icons your users would instantly recognize as the best representation of each action. For useful articles full of practical help, see the other design-themed posts on our blog.
To keep things simple, we’ll pick a few basic and intuitive React Material UI data visualization icons from the 1,100+ available:

Let’s create a component for our ReGraph app with a chart in it:
function MyReGraphApp(props) {
  const { items } = props;
  return (
    <Chart
      items={ items }
    />
  );
}
Now we’ll create a button component using Material UI’s prebuilt IconButton component:
import IconButton from '@material-ui/core/IconButton';
We can then extend this component to accept a clickhandler. This will update our ReGraph chart:
function ChartButton(props) {
  const { onClick, description } = props;
  return (
    <IconButton
      color="primary"
      aria-label={ description }
      component="span"
      onClick={onClick}>
      {icon}
    </IconButton>
  );
}
To control the chart’s handMode option, we’ll need to locate the chart’s instance methods and modify the options. The easiest way to do this is with the useState and createRef React Hooks. (For more details on Hooks, see Harnessing Hooks in your ReGraph code)
function MyReGraphApp(props) {
  const { items } = props;
  const chartRef = createRef(null);
  const [state, setState] = useState({
    handMode: true,
  });

  const { handMode } = state;
  return (
    <Chart
      Ref={chartRef}
      items={items}
      options={{
        handMode,
      }}
    />
  );
}
Next, we’ll define the actions that each button will perform. We do this in the MyReGraphApp component:
 function onZoomIn() {
    chartRef.current.zoom('in');
  }

  function onZoomOut() {
    chartRef.current.zoom('out');
  }

  function onPanMode() {
    setState((current) => {
      return ({ handMode: !current.handMode });
    });
  }
  function onTakePhoto() {
    const image = chartRef.image({ fit: 'chart' });
    // trigger a download of the image
    window.location.href = "data:application/octet-stream;" + image;
  }
Now we just need to add the buttons to our main MyReGraphApp component:
function MyReGraphApp(props) {

  ...

  return (
    <ButtonGroup>
    <ChartButton
      icon={<ZoomInIcon/>}
      onClick= {onZoomIn}
      description="Zoom in on the chart"
    />
    <ChartButton
      icon={<ZoomOutIcon/>}
      onClick= {onZoomOut}
      description="Zoom out on the chart"
    />
    <ChartButton
      icon={<PanToolIcon/>}
      onClick= {onPanMode}
      description="Zoom in on the chart"
    />
    <ChartButton
      icon={<PhotoCameraIcon/>}
      onClick= {onTakePhoto}
      description="Save the chart as an image"
    />
    </ButtonGroup>
    <Chart
      items={ items }
      options={{
        handMode,
      }}
    />
  );
}
And that’s it! We’ve implemented our own custom controls for our ReGraph chart using React Material UI.
We can also use the Material UI icons throughout our graph visualizations, representing nodes to match the style of the controls, or other aspects of data.

Now we know how easy it is to get the Material UI framework working with ReGraph, the design possibilities are endless.
We like React Material UI so much that we’ve used it to design showcase demos on our ReGraph SDK site. You’ll also find a fully-documented code example, demonstrating how to include Material UI icons, in the ReGraph SDK’s Storybook.
With ReGraph’s simple API and Material UI’s design framework, building high-performance, stylish graph visualization applications couldn’t be easier. You can add the slick graph visualizations your users deserve to your React application, while leaving much of the design-themed heavy lifting to Material UI.
To get started with ReGraph – the best React data visualization library – simply sign up for a free trial.