
Summary:
This article explains how AI, data visualization, and human judgement play different but complementary roles across the intelligence cycle. AI can rapidly process and analyze data, surface patterns, and generate recommendations, but humans are still essential for setting investigative direction, interpreting meaning, and making decisions. Graph visualization provides the context and explainability needed to understand AI-generated insights and communicate them clearly to others. The strongest results come when AI handles scale, visualization reveals structure, and humans guide the investigation.
Artificial intelligence is changing the way organizations think about data analysis. Data visualization and AI can do a lot of the heavy lifting for analysts and investigators working with connected data – helping them detect, understand and even predict risks and threats.
But if AI can analyze information – why visualize data?
And if AI can make recommendations, does that let humans off the hook?
Let’s look at when and how you should consider using AI to power investigations – and why humans and graph visualization are still an essential part of the intelligence cycle.
The data visualization and AI intelligence cycle
We’ve shared this diagram before. It shows how AI and data visualization, tempered by human reasoning, can power a threat management process that adapts to a changing landscape.
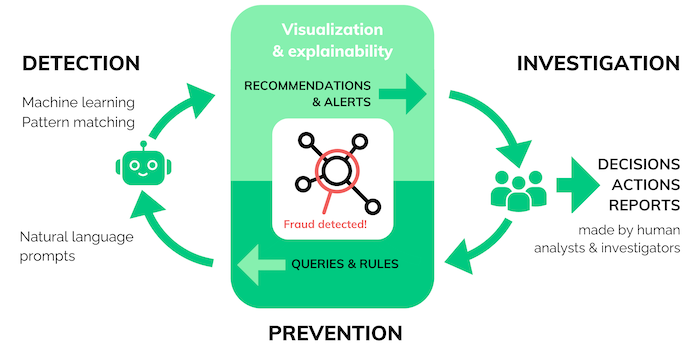
Machine learning, pattern matching and natural language prompts are great at rapid data processing and analysis – and data visualization is the key to a human understanding of AI-driven insights. At the end of each investigation cycle, it takes a human brain to digest the results and make an executive decision on what action to take.
In the world of fraud, for example, criminals adapt constantly to exploit new vulnerabilities. But there are always patterns of “known fraud” that AI excels at spotting.
The human analyst’s investigation would assess whether the AI had identified a genuine case of fraud – making inferences and judgements that are currently beyond the capabilities of machine learning.
At the prevention stage, AI could generate recommendations for changes in policy – but these would still need to be approved by a human executive.
In future, we could see AI technology developing to a level at which it could detect new types of fraud, predict connections and suggest counter-measures we may not have considered. But the case for human oversight is strong.
Let’s look at the typical stages of an investigation in more detail, and examine where the various strengths of graph visualization, AI and human reason are best applied.
Direction – every investigation starts with a question
There are many different ways you could choose to bring AI into the intelligence cycle, but it always starts with you. You have to decide:
- What interesting question needs to be answered
- What data will help you answer the question
Can AI step in here? Can it know what an “interesting question” is, and which datasets are relevant to that question?
You ultimately choose the objective of your investigation. Artificial intelligence can’t spontaneously conceive and launch a major business project, but it can support a human project manager who has set an objective. This is a theme we’ll see throughout the intelligence cycle.
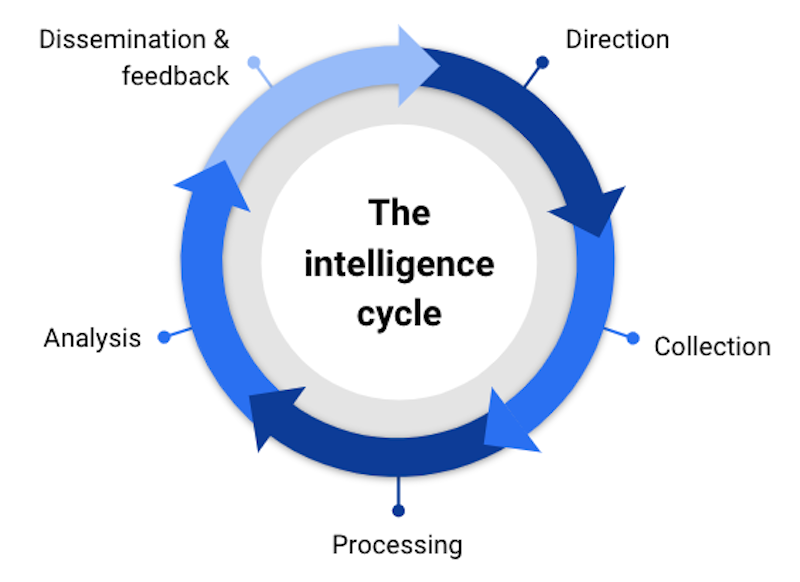
Collecting data
Do you need help collecting raw data? Probably not – it’s the easiest step. In fact, your biggest problem is likely to be the overcollection of data. It’s so easy and inexpensive to gather and store information that you could get overwhelmed (this is where the graph data funnel comes into its own).
It’s possible to train machine learning models to collect data. But the training process is time consuming and laborious, and it’s not a one-off task – models need frequent updates and monitoring. Even then, they can’t guarantee complete, accurate and up-to-date datasets, so you’d need to add data validation to your to-do list. It could waste all the time you saved when you delegated the data collection and categorization in the first place.
Machine learning models don’t currently cope well with data that’s incomplete, inaccurate or prone to change. They can’t match our human understanding of nuance, bias, political and ethical sensitivity, or domain-specific detail. They’re simply not designed for the job. Most analysts stick to alternative automated data collection tools such as web scraping, real-time streaming, or integration with various APIs and services.
Processing data
Most raw data gathered from multiple real-world sources is hard to work with. It’s inevitably full of errors, duplications, entity resolution challenges, fragmented or in the wrong format.
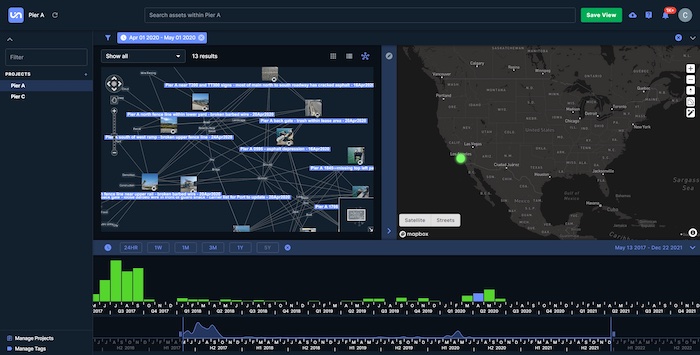
In the past, it was tough to automate data cleansing processes, because you’d need to write a set of rules covering every possible case. But this is an area where data visualization and AI are a powerful combination. Machine learning can categorize huge volumes of unstructured data, and a human can use graph visualization to investigate the edge cases or less obvious errors. You can read more about data cleansing with graph visualization here.
Once that’s complete, an analyst can explore the results in a data visualization component that presents it in a tangible and intuitive way. We’ll talk more about that in the next stage, but here’s an example of how it looks in practice, using one of our graph visualization toolkits:
Analysis – detecting risk and threat
Once your data has been collected, cleaned and categorized, it’s time to explore it for insights. You might choose to speed up the process with help from AI, using natural language prompts to query the data, or a large language model (LLM) to probe further.
AI, especially machine learning, is great at spotting specific behaviors. It excels at detecting known risk and threat, such as fraud or cyber attack patterns that have already been encountered, but it’s getting better at detecting new forms of malicious behavior, too.
Now that AI is so advanced, do we even need human investigators? Can’t we let self-training AI intercept new attack paths and detect unusual fraud patterns? The answer is almost certainly “no”. Just as AI couldn’t set the objective for your investigation, it’s no match for human instinct and experience when it comes to querying, exploring and understanding data.
What about data visualization – is that really necessary? Can’t we just use generative AI to report back to us? It’s possible that LLMs could generate natural language explanations of alerts – a chatbot could tell an analyst what it’s discovered, and be interrogated for further detail.
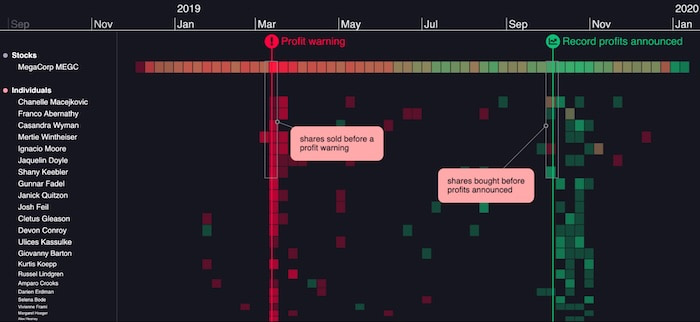
Many of our customers harness data visualization alongside AI-generated alerts. It brings a level of speed, accuracy, appropriate context and explainability you can’t get from an AI assistant. You could use a timeline visualization to interpret an alert caused by an unusual sequence of login activity:
Or a graph visualization to show an unusually highly connected set of insurance fraud claims:
With help from interactive data visualizations, a human can confidently make decisions based on automatically generated recommendations.
Dissemination and feedback
It’s not just the analyst who depends on data visualization. They’ll need to communicate their findings to a decision maker, who may not have the time, expertise and experience needed to understand the full investigation.
Intuitive data visualizations such as network graphs and timelines are the most effective way to communicate insights from complex connected datasets. These visualizations could be presented as evidence in judicial processes, or submitted as part of suspicious activity reports (SAR) to regulatory bodies, or shared internally with stakeholders.
Visualizations reveal the narrative behind a dataset, giving decision-makers the information they need to take action or change course.
Natural language generation (NLG) could play a role in signposting these narratives. But whether narratives are entirely machine generated, or added by users in the form of ‘virtual sticky notes’, they play a crucial role in making AI-generated data insights accessible to a wider audience.
Threat prevention
We’ve arrived at the most important stage of the cycle: it’s time to set the direction for the next stage of our investigation. Our AI has made recommendations, and our data visualization has given us context, and the chance to dig a little deeper for a better understanding of the investigation. Now it’s down to a human to decide on what action to take.
We can’t put artificial intelligence systems in charge at this stage. Regulatory and governance obligations aside, they shouldn’t be given the authority to choose a new cybersecurity solution, approve an insurance claim or make an arrest… that way lies the robot uprising.
Get to the answers faster with data visualization and AI
If we play to the diverse strengths of human analysts, AI technology and powerful graph visualization, we can uncover hidden insights in the most complex connected data. AI can automate some of our more tedious tasks, freeing up investigators to focus on the important insights that graph visualization is revealing to them – and ask the right questions as the cycle restarts.
AI can help us think laterally, revealing unexplored areas for further investigation – and graph visualization can help us navigate through the complex connections in our investigation as it evolves. But it needs to be tempered by human reason at every stage.
If you’re thinking of bringing AI into your project, your fellow humans will need to be prepared with the latest data visualization technology. Get in touch for a free trial today.
Share:
