In this blog post, we see how Unstruk Data‘s unstructured data platform uses ReGraph, our graph visualization SDK for React developers, to help people transform big, complex data into actionable insights – and to make unstructured data analysis easy and accessible for enterprises of any size.
The untapped potential of unstructured data
Modern organizations have a wealth of data at their fingertips, whether they’re a global enterprise or a growing start-up. But around 80% of that is ‘unstructured’ data – such as images, videos, emails, phone calls and other media files. It’s incredibly hard to manage, and data that can’t be processed, indexed and analyzed is useless.
Let’s take the example of a maintenance manager at a large port facility. Every day, they generate huge volumes of unstructured data on routine dockside inspections – using various mobile devices to take photos and record voice notes of any issues they see.
Once they’ve generated all this unstructured data, what do they do next? Most likely, they’ll save it to their computer, where 99% of it will never be accessed again. Or maybe they’ll print the photos and fill their office walls with a physical gallery of the port, hoping to quickly identify any issues. (This isn’t as uncommon as you’d think).
Machines are great for collecting, storing and processing data, but they can’t spot unusual connections or understand the consequences of what’s captured in it. Humans are good at those cognitive processes, but can get quickly overwhelmed by a mass of print-outs or an avalanche of files.
The ideal approach is to apply machine learning to give structure to the data, and then let the manager analyze and explore it visually. That’s exactly what Unstruk does.
The world’s first truly unstructured data platform
Unstruk saw organizations struggling with chaotic, ever-growing silos of unstructured data and set out to build the solution.
The result is an impressive unstructured data capture, storage, analysis and visualization platform that combines smart machine learning algorithms with the human ability to understand patterns. It uses ReGraph’s interactive visualizations to give users a 360-degree view of their unstructured data, bringing it to life in a way that’s easy to understand and explore.
“It was going to take our developers 6 months to build the complex graph components we needed, and we didn’t have that kind of time. We looked at some open source options, but none of them could handle the volume and variety of data that our customers need to navigate. Then our Chief Technology Officer suggested ReGraph, and we knew right away that it was the perfect fit.”
– Chris Katz, Head of Product and Engineering, Unstruk Data Inc.
Powerful analysis for any industry, from robotics to film studios
Unstruk supports a wide variety of use cases, from autonomous vehicle data and industrial robots’ records, to engineers managing CAD files or media producers working with terabytes of video and image data.
Users upload their data, no matter where it is, either via the Unstruk Lens web application or the Unstruk Sessions mobile app, to the Unstruk Data Platform. Unstruk’s machine learning algorithms then get to work, identifying different elements and features in the files, and intelligently indexing and tagging them.
The result is a newly-structured dataset for users to visually explore using Unstruk Lens – an integrated dashboard application with geospatial views and ReGraph-powered time and graph visualizations.
Let’s take a closer look.
Bringing unstructured data to life with Unstruk Lens
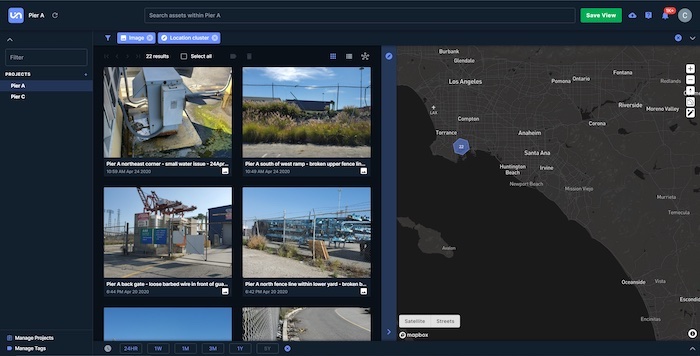
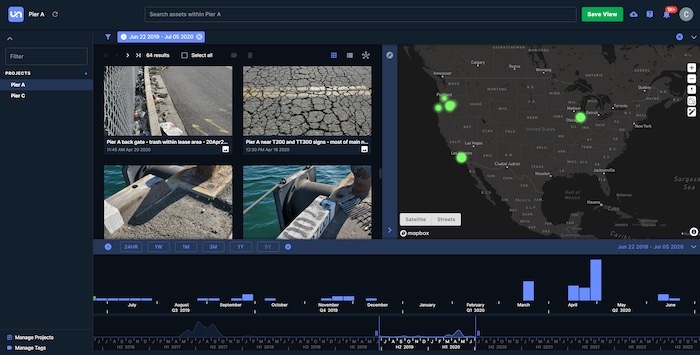
The analysis begins with a detailed view of their assets in the Unstruk Data Platform. Here the user navigates or searches their way through their imported data, with handy filtering options to identify the files they’re looking for.
It’s not easy to manually navigate 250 related files, much less 2,500 or 250,000, so they need more powerful analysis tools. A geospatial view shows where the files were generated:
But to really dig into the unstructured files, we turn to ReGraph.
ReGraph’s unique double time bar view
When the Unstruk team set out to build their dashboard, they knew time-based navigation would be key to its success.
“We want our users to have complete control over their unstructured data, and that means approaching it from as many angles as possible. ReGraph’s interactive time bars add a different dimension to our dashboard – pioneering a whole new way to search for insights.”
– Chris Katz
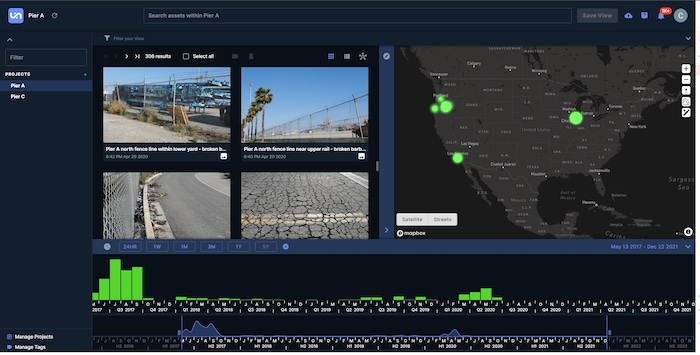
When it came to building a time-based filtering and search function, Unstruk hit on the smart idea of doubling up the ReGraph time bar component, stacking one above the other.
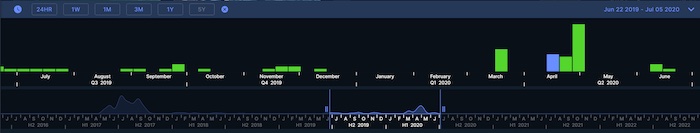
The area time bar along the bottom lets the user filter by time across the whole dataset, with the highlighted time period displayed in the histogram above. A quick visual scan of the histogram time bar highlights troughs and peaks of volumes and allows an analyst to quickly navigate to specific dates or events for closer inspection.
The components are integrated too. Changing the time period adjusts the assets and map view:
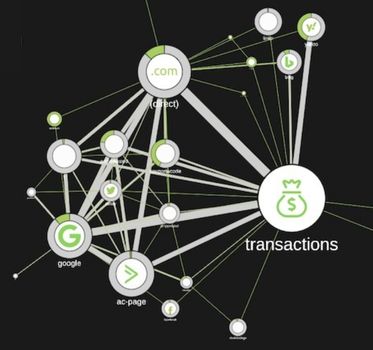
A 360-degree view of unstructured data, powered by graphs
The combined time and geospatial visualizations give strong situational awareness, but ReGraph’s graph visualization adds even clearer context.
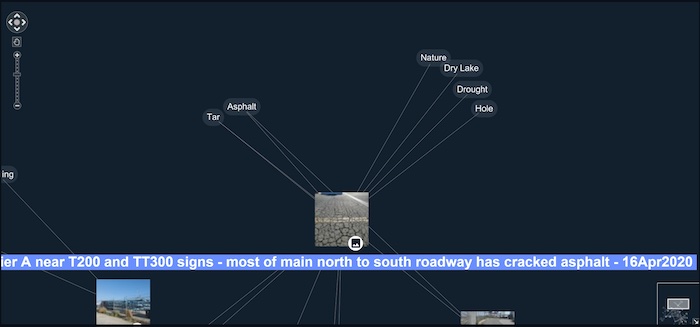
The machine-learning enriched dataset is a vast network of connected tags and assets, ready to be visualized as a graph. This is Unstruk Lens’ third integrated component:
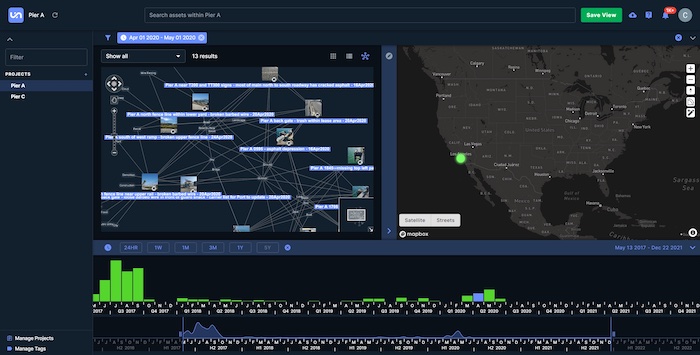
The connected view empowers the user to explore their dataset in a structured, systematic way. They’re able to search for specific asset features – from obvious things like file or device type, to more sophisticated tags generated by image recognition or analysis.
The future – even more advanced machine learning
“We’re democratizing unstructured data analysis tools – giving all businesses the capabilities that only the Googles and Facebooks of the world have now. The Cambridge Intelligence team has helped us realize our ambitious plans and encouraged us to experiment with new ideas, often suggesting solutions or bonus features that wouldn’t have occurred to us.”
– Chris Katz
And we’re still working with Unstruk to make their application even stronger. In the coming months, they plan to expand their machine learning algorithms to identify, understand and classify any type of data. As the application develops, they can rely on ReGraph’s powerful graph and time-based visualization functionality to make the user experience as easy, enjoyable and productive as possible.
“ReGraph lets the data speak for itself, and really helps bring the user’s inter-connected unstructured data to the forefront. Adding graph and time visualization to Unstruk Lens was a game changer – revealing connections, patterns and time-based insights that can help businesses make fast and well-informed decisions when it matters most.”
– Chris Katz
To learn more about Unstruk and the Unstruk Data Platform, visit their website
Want to try ReGraph for yourself? Request a trial
Ready to visualize your connected data?
Bring clarity, confidence and interactive intelligence to your product – with visualizations that transform how users understand and explore complex data.
Share: