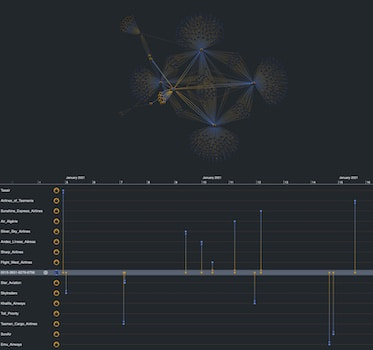
Identity fraud detection with Amazon Neptune
Corey Lanum Chief Product Evangelist
3rd January, 2023 | 15 min read
Follow this tutorial to build an interactive web application – integrated with Amazon Neptune – to...
Corey Lanum Chief Product Evangelist
3rd January, 2023 | 15 min read
Follow this tutorial to build an interactive web application – integrated with Amazon Neptune – to...
Corey Lanum Chief Product Evangelist
2nd August, 2022 | 13 min read
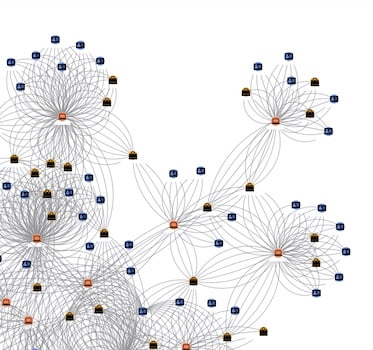
In this technical blog post, I show you how to get KeyLines, our JavaScript toolkit for graph visualization,...

Catherine Kearns Content Strategist & Team Lead
27th October, 2020 | 12 min read
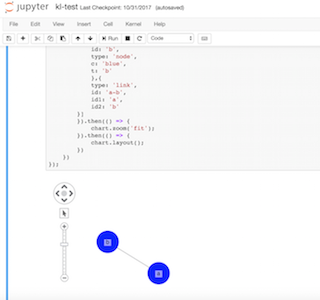
In this blog post we’ll show you how quick and easy it is to integrate JupyterLab and ReGraph to create...
Duncan Grant Sales Engineer
8th January, 2018 | 5 min read
Sharing intelligence is a key part of every graph analysis workflow. Once your connected data has been explored,...
Registered in England and Wales with Company Number 07625370 | VAT Number 113 1740 61
6-8 Hills Road, Cambridge, CB2 1JP. All material © Cambridge Intelligence .
Privacy Policy | Security Framework
