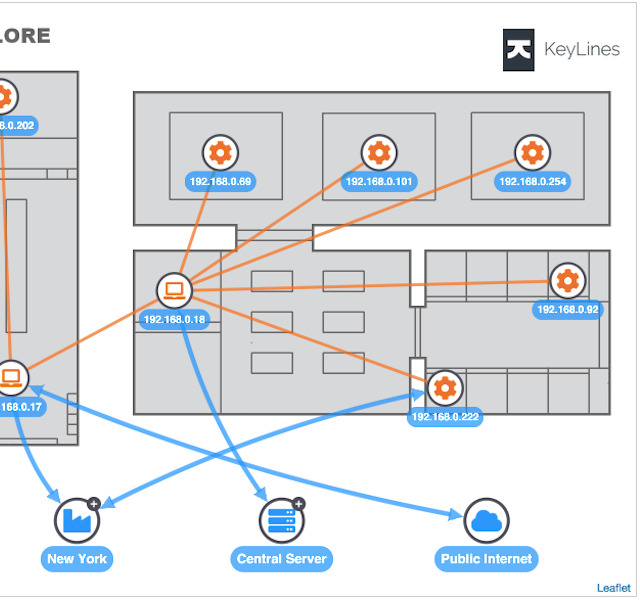
Map-based connections: presenting graphs on images with KeyLines
Phil Rodgers Principal Team Lead
20th August, 2025 | 5 min read
This developer tutorial demonstrates how to use images as backdrops. With detailed code examples throughout,...
Phil Rodgers Principal Team Lead
20th August, 2025 | 5 min read
This developer tutorial demonstrates how to use images as backdrops. With detailed code examples throughout,...
Khadeja Sajjad Software Developer
9th November, 2023 | 9 min read
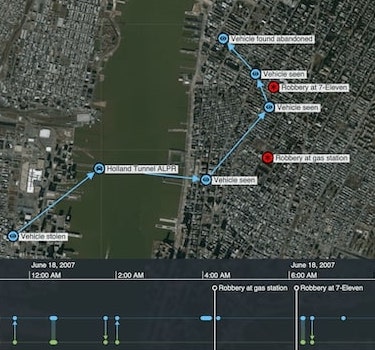
Analysts rely on our data visualization toolkits to spot hidden patterns in their visualized data. They...

Bonney O'Hanlon Product Manager
7th February, 2023 | 6 min read
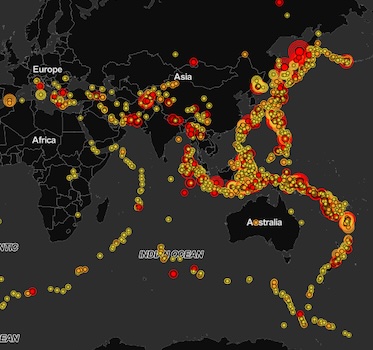
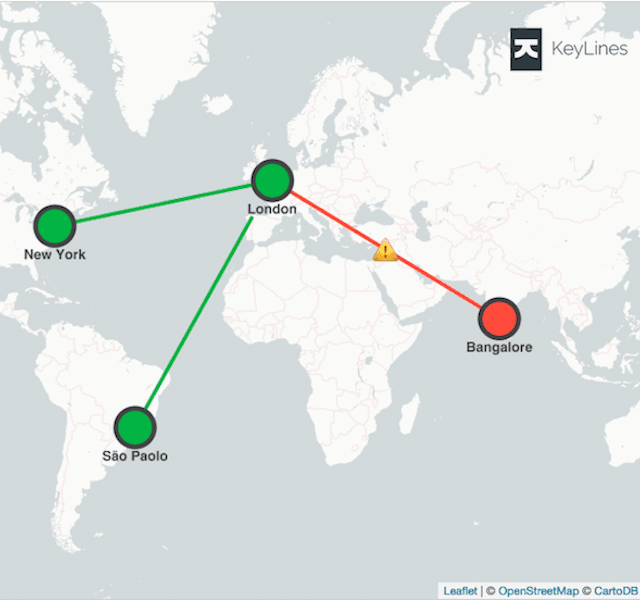
We explore map data visualization: what it is, what it’s for, and why you need it if you’re serious about...
Thomas Chan Software Developer
12th February, 2019 | 7 min read
Learn how to integrate KeyLines with Esri’s open source esri-leaflet library to access their ArcGIS mapping...
Dan Williams Chief Product Officer
20th November, 2018 | 2 min read
We’re excited to announce the release of KeyLines 5.0: the next generation in visualizing connections in...
Dan Williams Chief Product Officer
17th October, 2018 | 7 min read
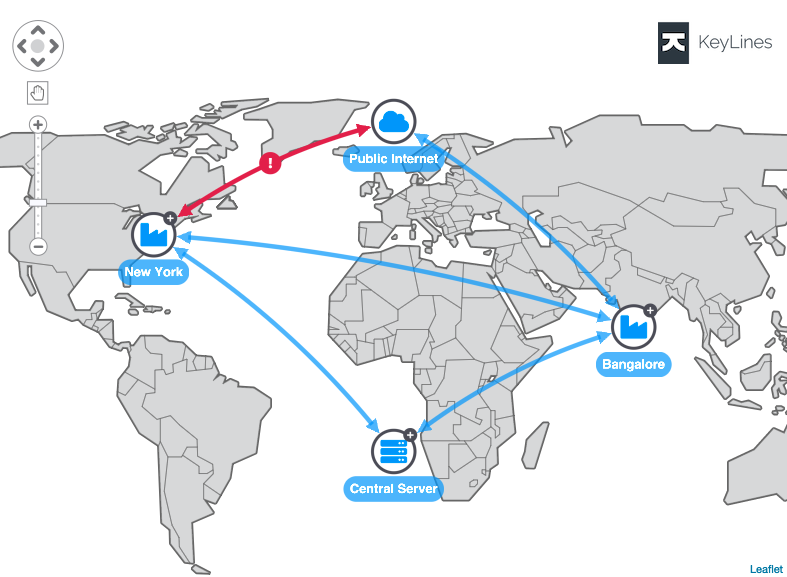
With KeyLines and Neo4j graph database integrations, exploiting geospatial data has never been easier. Discover...
Registered in England and Wales with Company Number 07625370 | VAT Number 113 1740 61
6-8 Hills Road, Cambridge, CB2 1JP. All material © Cambridge Intelligence .
Privacy Policy | Security Framework
