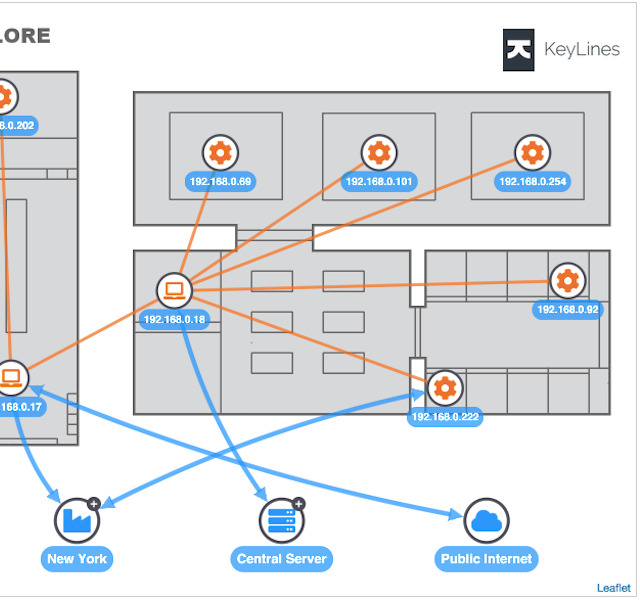
Map-based connections: presenting graphs on images with KeyLines
Phil Rodgers Principal Team Lead
20th August, 2025 | 5 min read
This developer tutorial demonstrates how to use images as backdrops. With detailed code examples throughout,...
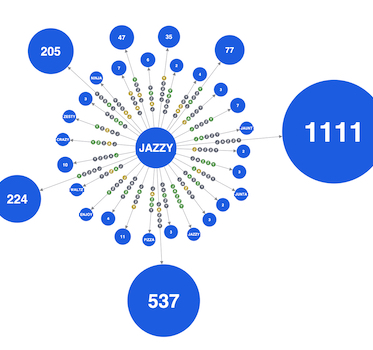
Visualizing Wordle tactics with KeyLines
Phil Rodgers Principal Team Lead
8th February, 2022 | 3 min read
We’ve used KeyLines, our graph visualization toolkit, to reveal the word that gives you the best tactical...
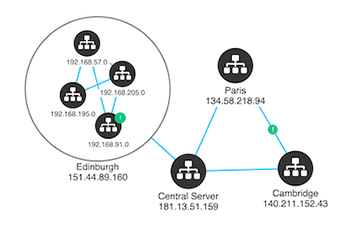
How to build great network visualizations
Phil Rodgers Principal Team Lead
3rd September, 2014 | 6 min read
A step-by-step guide to the process of building great network visualization applications – from...

Visualizing data with HTML5 Canvas
Phil Rodgers Principal Team Lead
11th June, 2014 | 3 min read
This blog post gives developers practical tips for building web-based data visualization applications using the...
