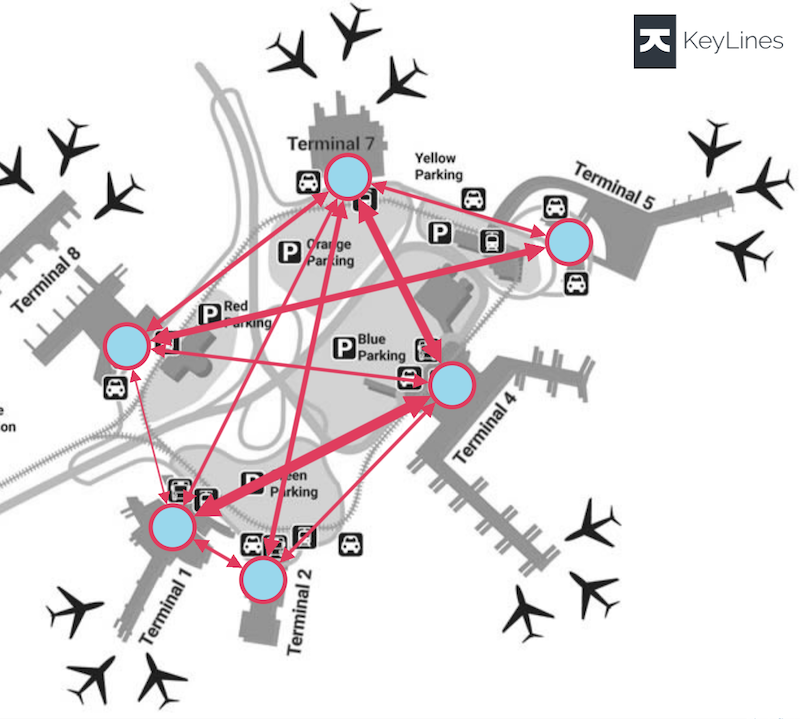
Understanding map-based connections has always been a key graph visualization technique. But map-based visualization can take many forms – from traditional geographic views of the world to city subway systems or nautical charts.
Our KeyLines toolkit’s powerful mapping feature isn’t just for viewing links between nodes with latitude and longitude properties.
Since version 5.0, KeyLines offers the flexibility to position graph items on any kind of background image. You can choose the view that will make the most sense for your users: floor plans, building layouts, virtual representations, IT infrastructures – simply select your image backdrop and map your graph data to it. Better still, you can also transition seamlessly between images and traditional geospatial maps, creating a map data visualization to better convey useful insight.
This developer tutorial demonstrates how to use images as backdrops. With detailed code examples throughout, you’ll see how easy it is to provide custom context for your visualizations.
Mapping a virtual private network (VPN)
We’ve chosen to visualize a fictional organization’s IT infrastructure, with two physical sites connected to a central server via a VPN. Each site contains a number of terminals and factory machines which regularly communicate with each other.
We’ll use a simple data structure to manage the different background images that we’ll present data on. As you can see, KeyLines supports both SVG and JPG images.
const images = {
  Bangalore: {
    url: 'images/imagemaps/factory2.jpg',
    width: 2058,
    height: 1050,
  },

  // ...

  'Central Server': {
    url: 'images/imagemaps/webserver.svg',
    width: 2058,
    height: 1050,
  },
};
Configuring the map and loading chart data
KeyLines uses the popular Leaflet mapping component to implement its geospatial feature. By default, this shows graph nodes at defined geographic positions with a standard map appearance. This means you simply need to specify the latitude and longitude for your nodes, and KeyLines does the rest.
With a little configuration, we can tell KeyLines to use one of our specified images instead of its default map.
First we set some options, load the chart data, and display the map with its custom background:
  await chart.map().options({
    leaflet: {
      crs: L.CRS.Simple
    },
    tiles: null,
  });
  await loadMapData();
A few things are happening here:
- the chart.map().options call specifies options to pass to the Leaflet mapping component.
- the CRS setting specifies which Coordinate Reference System to use – this tells Leaflet how to map from latitude and longitude to positions on the map tiles. With an image background, we use CRS.Simple – which just maps latitude and longitude directly to x, y positions on the image.
- the tiles: null setting tells KeyLines not to display the standard map tiles – we’ll add a background image to the map instead.
async function loadMapData() {
  chart.load(data);
  await chart.map().show();
  setBackground('Bangalore');
}
Once the map options are set, we call chart.load to add nodes and links to the chart. This uses a simple JSON-based format to specify how the nodes and links are connected, and what they look like.
Next, we enable a geospatial layout with chart.map().show(), and then call setBackground to display one of our set of background images.
Creating and adding the map data visualization
In setBackground , we create an image overlay and add it to the map, removing any previous image overlay:
function setBackground(imageId) {
  const data = images[imageId];
  const bounds = [[0, 0], [data.height, data.width]];

  if (backgroundOverlay) {
    backgroundOverlay.remove();
  }

  backgroundOverlay = L.imageOverlay(data.url, bounds);
  backgroundOverlay.addTo(chart.map().leafletMap());
}
Let’s break down what’s happening here:
- the data for the image we want to use comes from the images object we defined earlier.
- the bounds array specifies the coordinate range that we can use to position items on the image.
- we remove any previous image overlay, then create a new one with the specified image url, and add it to the Leaflet map.
KeyLines makes the leaflet map object available so we can use it directly with standard Leaflet functions. Later we can call setBackground again to change the background to a different image dynamically as the user navigates through the data.
Using an image as a backdrop brings the IT network to life
To position nodes on the background image, we simply use the pixel position as their latitude and longitude. In the data object, the nodes will look something like this:
{
  "type": "node",
  "id": "srv001",
  "c": "rgb(0,150,255)",
  "t": "Central Server",
  "pos": {
    "lng": 800,
    "lat": 200
  }
}
Once the chart data is loaded, we can use the KeyLines API to change the node position and appearance and respond to any user interaction you like. For example, when users double-click on an item, we can update the display to drill down into specific parts of the network.
Ready to try KeyLines graphs on images?
Custom designed network mapping software is a great way to understand at a glance what’s really going on in your data.
The full source code for this example is available from our SDK site along with over 80 other demonstrations. To get access, request a free trial.
And if you want to take your geospatial data visualization to the next level, try MapWeave. It comes with expert support, docs, inspirational demos and a smooth DevEx, plus easy integration with our other SDKs.
Share: