
In this post, we explore geospatial data: what it is, what it’s for, and why map data visualization is used by every business that’s serious about analyzing connected data.
Our world has become much more geo-orientated since the explosion of smart technology like cellphones, watches, fitness trackers and more. So many apps have a built-in map mode that helps us with common activities like ordering a takeaway, checking the local weather forecast or booking a weekend away.
We use geospatial data everyday and we don’t even realize it.
What do we mean by geospatial data?
Geospatial data simply means any data with a specific location attached. It’s commonly associated with geography and cartography, but every person, object or event can be represented as geospatial data. The geospatial element could be small or large scale: from pinpointing the location of your mobile phone or plotting the fastest route from A to B, to surveying a thousand-acre forest or maintaining critical national infrastructure assets.

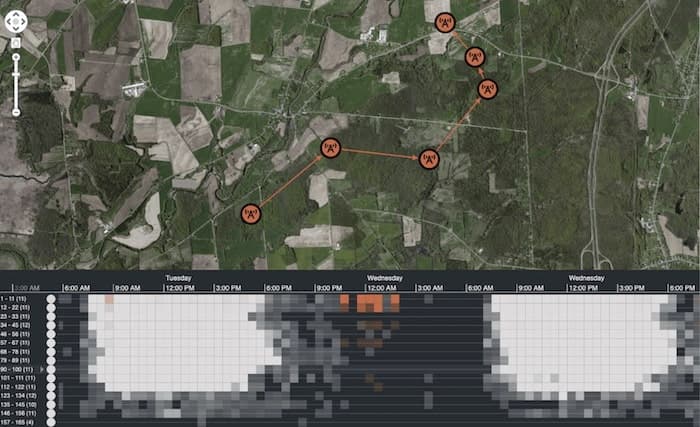
Geospatial data can have a time-based element too. It helps us track everything from the time it takes to cycle through town or the location of a delivery driver, to the spread of infectious diseases or the degradation of glaciers over weeks, months and years. Geospatial data becomes even more powerful when you can interact with it and watch it evolve over time.
Why visualize geospatial data?
Sometimes, data can be hard to understand until you see it in the context of the world you live in. Map-based data comes to life with geospatial visualization. When you combine geospatial charts with additional network or timeline data, you gain more insights from seeing entities and events in real-world scenarios rather than as columns and rows in a table.
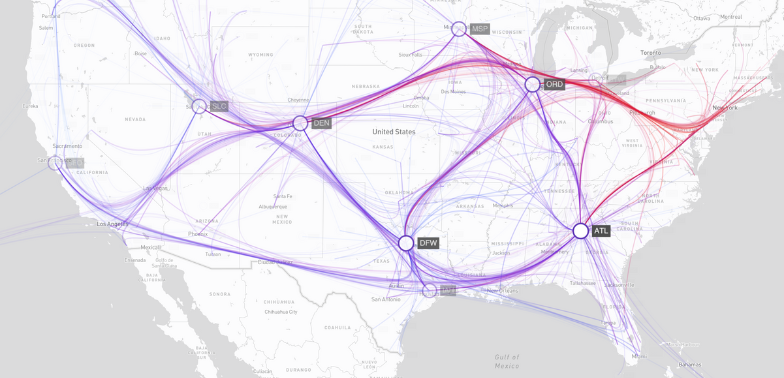
If your data contains location information as latitude and longitude properties, you can visualize it easily. You can also add ordinary images as scalable background maps to give better context to visualizations and create powerful dashboards.
This IT infrastructure example combines a background image of a New York office’s server setup with a global view of the entire network:
For more details on how to create a background image and map view, see Map-based connections: presenting graphs on images
How has geospatial visualization evolved?
Until recently, geospatial technology was a specialist, niche domain. It took huge software programs with steep learning curves to produce a simple digital map. That was still a significant progression from the original paper map when cartography was an artform in its own right.
Digital mapping in the 1960s paved the way for geospatial data visualization. In the early days, digital maps had to be built layer by layer. This was a time-consuming process for the commercial or government agencies who often kept their source map data private.
The goal of digitizing maps was to make them easier to store, and faster to continuously update and access. Other technologies evolved and improved the data collection process further with enhanced aerial photography, satellite imagery and remote sensing.
Network and timeline analysis requirements have evolved too, as organizations want to boost their visualizations with maps. Our geospatial visualizations give you the power to interact with entities and events plotted on top of a detailed, customized background map image of your choice.
As most software now has an integrated mapping capability, we’ve instinctively accepted geospatial data as a part of our everyday lives. We often take for granted the extra insight that comes from visualizing geospatial data – no more getting lost in a new city or having to guess where the next gas station is on your car journey.
Your users have come to expect a map mode wherever possible too. If their connected data contains valuable insights or hidden threats, you want to give them the investigative tools they need to visualize and analyze what’s important.
Who needs map data visualization?
Anybody with location-based graph and timeline data benefits from the ability to see it on a map, but we’ll cover just a couple of the most popular use cases here.
Geospatial charts for security and law enforcement
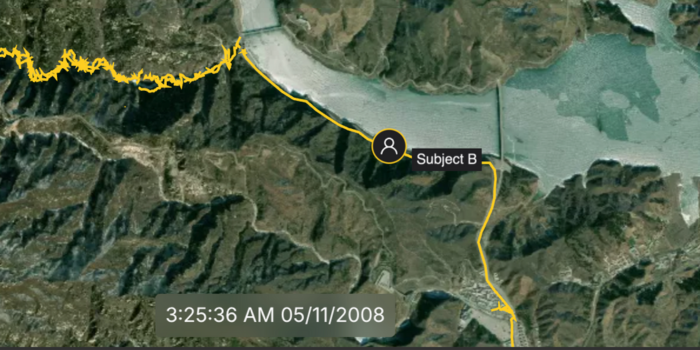
Our customers working in anti-terrorist and law enforcement spaces find our geospatial visualization technology essential. Real-time situational awareness relies on dashboards that must be easily understood by everyone involved, and map data visualization provides the necessary real-world context.
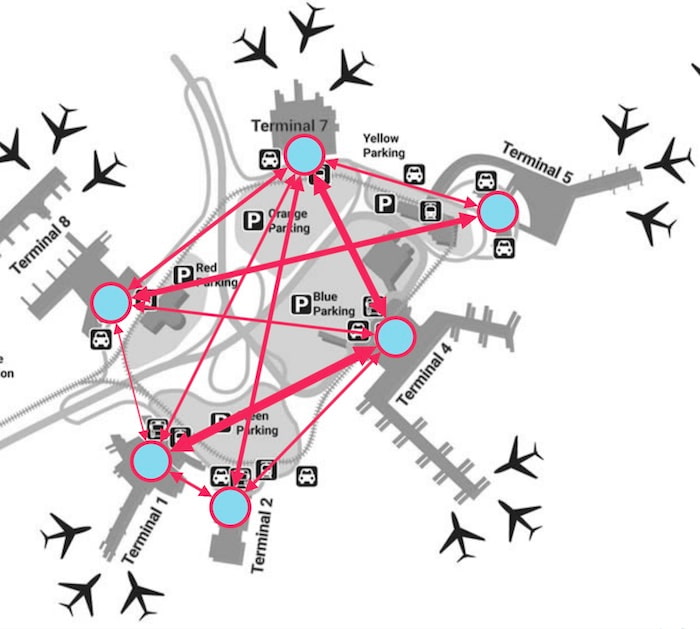
Security agencies use background images in charts to visualize nodes and links on everything from building footprints to transport hubs, crime scenes to prison layouts. They can be customized however you want to suit the needs of your user.
Map data visualization and supply chains
Another significant use of our mapping tools is in supply chain management. From retail and manufacturing to governments, healthcare and pharmaceuticals, visualizing and tracking the movement of products over time uncovers bottlenecks, prevents disruption, and helps with regulatory compliance.
How does map data visualization work with our graph visualization SDKs?
Using the map mode layout is easy. Under the hood, our data visualization toolkits use Leaflet, the popular JavaScript library for interactive maps. This gives you the freedom to choose from a huge ecosystem of map tile providers, projection systems and third party plugins.
If you’re using Esri mapping systems, check out the integration details in Esri ArcGIS data visualization for powerful geospatial analysis
MapWeave: the geospatial visualization SDK that uncovers every connection
If you need to take your geospatial data visualization to the next level, check out MapWeave. It comes with expert support, docs, inspirational demos and a smooth DevEx, plus easy integration with our other SDKs.
Share:
