Whatever supply chain model you choose, industry you’re in, or product or service you provide, the goals remain the same. You need to reduce costs, increase profitability, reduce risk and keep your customers happy.
Successful supply chain managers, resilience managers and original equipment manufacturers have data visualization at the core of their supply chain management. It’s the proven method for making sense of interconnected relationships at scale.
If you’re new to data visualization or just want to optimize every stage of your supply chain, our ultimate guide to supply chain visualization is for you. You can download it for free now, or read on for a sneak peek of its contents.
Supply chains aren’t chains, they’re networks
A supply chain is a network of complex connections: between suppliers, partners, processes, systems, customers and more. Like any busy network, if you can map every item together with the web of links between them, you’ll find it easier to understand and manage a smooth-running supply chain.
Real-world examples of supply chain challenges
Our visualization guide gives practical tips on how visual analytics will transform your supply chain management: from how to manage risk to supporting full transparency. It also features case studies to illustrate real-world problems and solutions. Here’s a preview.
Finding the source of a serious issue fast
The 2006 E. coli contamination of fresh spinach products in the US resulted in hospitalizations, deaths and a prolonged (and costly) shutdown of the entire spinach production supply chain.
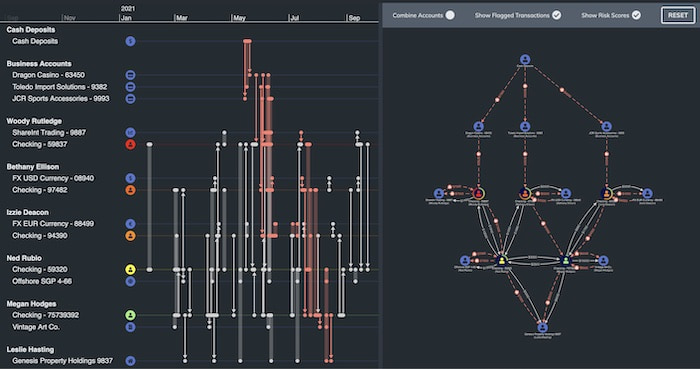
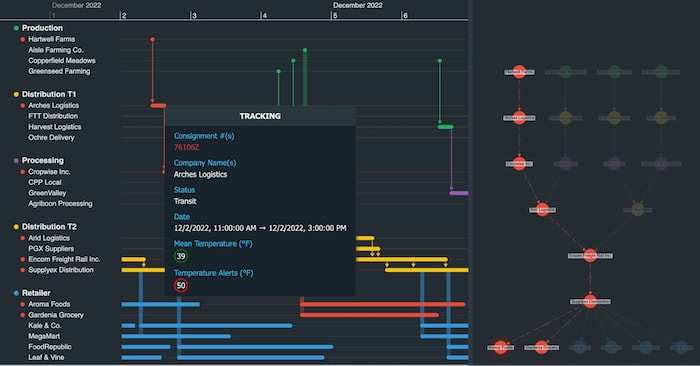
We can rely on advanced visualization technology to comply with regulations, identify alerts and trace the source of issues fast. We’ve visualized a supply chain as a timeline and a network chart to demonstrate this. In our scenario, we discover a contaminated bag of spinach at a grocery store and need to track back through every stage – from farm to packaging to transportation and distribution – to find and deal with the primary source.
Simplifying the complex world of vehicle production
When a standard car has 30,000 parts, every stage of the global supply chain must be carefully managed, optimized and synchronized. That’s some challenge.
Supply chains on this scale pose additional hurdles too – from transportation blockages to compliance regulation, sourcing reliable suppliers to sudden and prolonged factory shutdowns due to COVID-19.
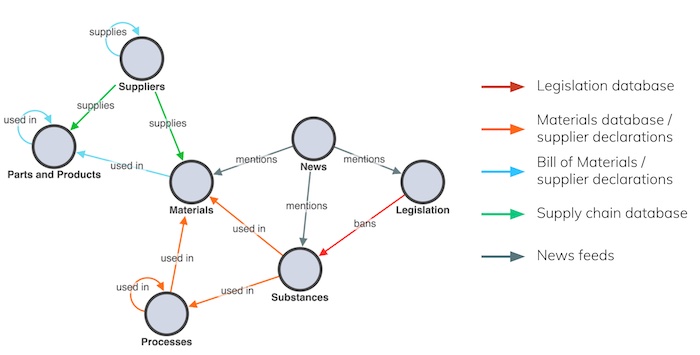
The ultimate guide outlines how managers use data visualization to identify risks and mitigate against delays. There are examples on using graph models for proactive compliance of potentially hazardous chemicals, advanced graph algorithms to identify critical paths, how to make data inside valuable assets such as Bills of Materials (BoM) accessible, and more.
Download your free supply chain visualization guide
An efficient and responsive supply chain relies on good data insights. To find them quickly and easily, you need data visualization tools. Our guide outlines the crucial role data visualization plays in making sense of your most complex supply chain.
Download it today and start your data visualization journey.
Share: