FREE: Visualizing supply chains for network & timeline analysis
The ultimate guide to efficient, responsive supply chains using data visualization.
Have you ever wondered about the parts that make up your car, and what they’re made of? It’s easy to assume that the original equipment manufacturer or ‘OEM’ (that’s the company whose badge is on the front of your car) will know, but remember that modern cars have around 30,000 – 40,000 parts, and most of them were built by a complex chain of thousands of part suppliers, not the OEM itself. Each part is made by combining materials together using one or more processes.
The materials in turn might be made up of dozens of chemical substances. For example, plastics and rubbers are made of a complex and often top-secret formulation. Yet more substances are consumed in the processes (think using a degreaser or adhesive in a manufacturing step). If your car had to carry a printed recipe like the chocolate bar you had at lunchtime, it would not make for light reading.

Legislations on hazardous substances are important in this domain. The EU’s REACH directive is a great example. Among other things, REACH creates legal obligations for companies who produce or supply articles containing so-called Substances of Very High Concern (SVHCs). There were 182 of these substances at the last count, and many are used to give everyday materials the properties that we take for granted: corrosion-resistant chrome coatings, or the pigments and plasticizers used to make flexible, colourful plastics.
The challenge REACH compliance gives engineering organizations seems insurmountable: they must understand their exposure to the legislation and then do something proactive about the risks.
Why is the REACH compliance challenge so difficult? Part of the problem is the scattered nature of the data. The relationship between a chemical substance and the regulations which govern it are published by the relevant authorities but change from year to year. Relationships between part and material might be spread across a nebulous world of Bills of Material (BoMs) and Product Lifecycle Management (PLM) systems. The relationships between materials and substances (the ‘recipes’) are the hardest piece of the puzzle. They usually require frequent pleas for information from raw material suppliers who give away few details to protect the IP of their secretive formulations.
But even when manufacturers get all this information into one single, convenient store, would that be enough for them to achieve REACH compliance enlightenment? What piece of actionable intelligence would they look for first, and what would they do with it?
KeyLines customers have taught us something at Cambridge Intelligence: that the best analysts are not necessarily database experts. Human beings don’t always know what they are looking for until they’ve found it.
The ultimate guide to efficient, responsive supply chains using data visualization.
What would be the effect of a particular chemical substance becoming obsolete on an organization whose products are built from a complex recipe of material and process specifications?
As with many regulatory compliance challenges, we can describe the problem using a graph structure. Let’s start with a simple model where nodes correspond to legislations, substances, materials, processes and components, and links represent the use of something in the supply chain.
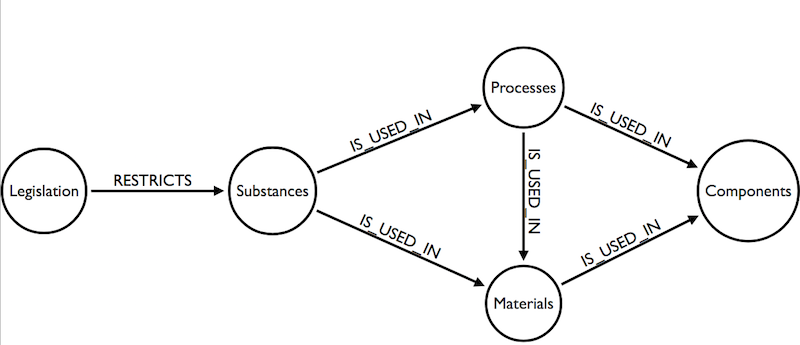
Graph data structures like these are great at providing insight. You can quickly see which nodes are the most ‘influential’, or which specifications are on critical paths and are therefore most vulnerable to obsolescence or undocumented reformulation.
It’s hard to ask a typical database these questions, and harder still to ask multiple databases. But get the visualization right, and it becomes as easy as asking: “what does this picture tell you?”
Analysts empowered with a visualization tool have a number of strategies available to them. They might start with the ‘haystack’ and immediately see the complex clusters that stand out. These clusters could represent major obsolescence risk.
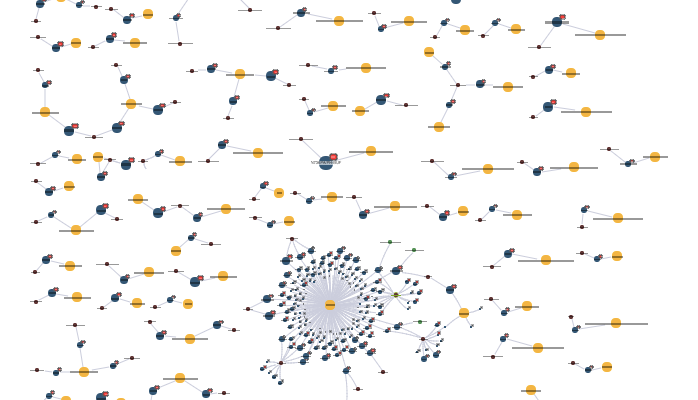
Alternatively, a REACH compliance analyst might start with the ‘needle’: zoom in on a chemical substance of interest, and try and understand how it affects their business.
In the example above, the analyst begins with Cadmium Chloride, an SVHC on the REACH list, and explores outwards. We’ve used a number of KeyLines features to make the user experience better:
Now back to the question: “what would happen if this chemical became obsolete?”
Removing a substance from the supply chain – perhaps because of legislation – can have a knock-on effect which can bring a manufacturer’s assembly lines to a standstill with costs running easily into the millions.
In the example below, we’ve encoded this question into a simple workflow using some common KeyLines capabilities. When the user asks for an ‘impact analysis’ for a particular chemical (or list of chemicals), we can:
With a few simple interactions, the analyst has discovered that two material specifications used in the business use cadmium chloride, a REACH Substance of Very High Concern. One of these materials uses the chemical indirectly. It’s used in a process which itself is used in another process, which is used in the manufacture of the material.
The analyst can now tell the business that particular materials are at risk from the REACH legislation, an potentially jeopardize their REACH compliance status. Even better, they can provide actionable advice to target and replace a particular electroplating process.
This post is just an illustration of how graph visualization techniques can help manufacturing companies understand the complex connected data associated with restricted substance and REACH compliance. We’d love to see how this approach works using real-world data. If you’d like to try KeyLines for yourself, just start a trial or contact us.
Registered in England and Wales with Company Number 07625370 | VAT Number 113 1740 61
6-8 Hills Road, Cambridge, CB2 1JP. All material © Cambridge Intelligence .
Privacy Policy | Security Framework


