Product updates: Performance and clarity at scale
Rosy Hunt Content Marketing Specialist
10th February, 2026 | 2 min read
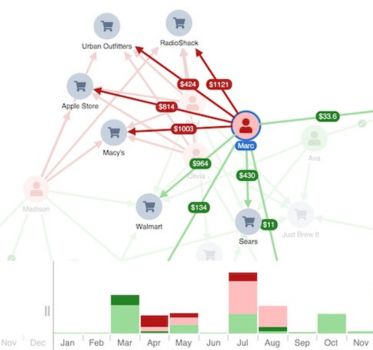
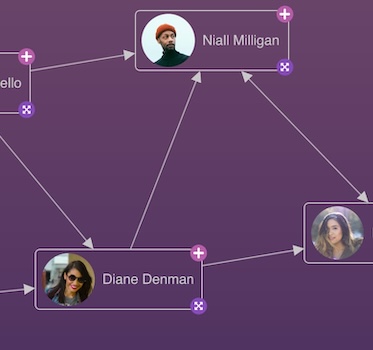
How do you keep your graph application responsive while helping users understand what they’re seeing? Our...
Rosy Hunt Content Marketing Specialist
10th February, 2026 | 2 min read
How do you keep your graph application responsive while helping users understand what they’re seeing? Our...
Rosy Hunt Content Marketing Specialist
27th October, 2025 | 3 min read
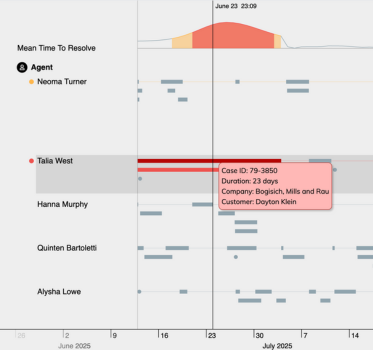
Whether you’re visualizing network graphs, timelines, or geospatial data, our latest SDK updates give you...
Rosy Hunt Content Marketing Specialist
10th July, 2025 | 4 min read
The newest versions of our data visualization tools bring features that make them faster, better-looking, and...
Courtney Collins Product Manager
13th May, 2025 | 3 min read
From sleeker animations to richer styling and smoother interactions, these updates help you create visualizations...
Dan Williams Chief Product Officer
8th May, 2025 | 3 min read
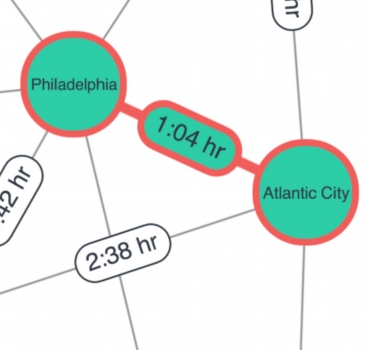
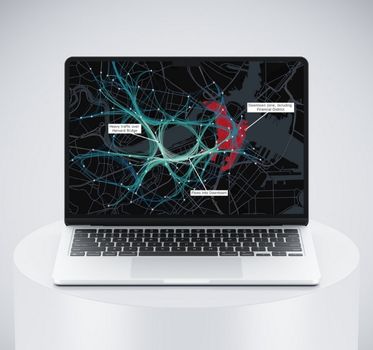
MapWeave, our new geospatial data visualization SDK for building map-based investigation and intelligence tools,...
Clare Haynes Product Designer
4th February, 2025 | 3 min read
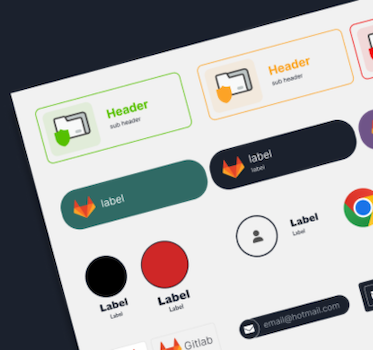
Good user experience (UX) design is the foundation of a successful data visualization experience. It lets users...
Courtney Collins Product Manager
3rd December, 2024 | 3 min read
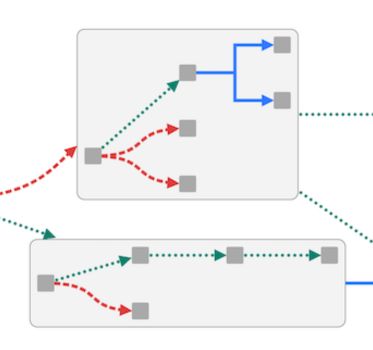
The latest versions of our graph visualization toolkits bring new link options that make it easier than ever to...
Courtney Collins Product Manager
15th October, 2024 | 4 min read
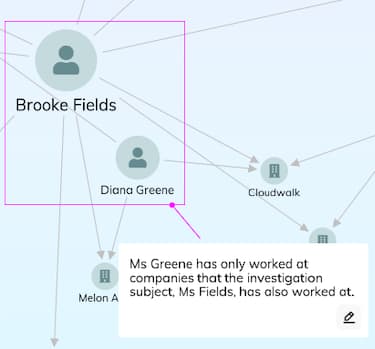
Get ready to tell the story of your complex data – our latest major releases mark a big leap forward in the...
Courtney Collins Product Manager
17th July, 2024 | 2 min read
New versions of KeyLines and ReGraph bring more freedom to create custom nodes, greater image & font icon...
Registered in England and Wales with Company Number 07625370 | VAT Number 113 1740 61
6-8 Hills Road, Cambridge, CB2 1JP. All material © Cambridge Intelligence .
Privacy Policy | Security Framework
