
Since its launch at the start of 2018, the Amazon Neptune graph database has become a popular choice.
We’ve seen a big uptick in the number of Cambridge Intelligence customers using it, with developers telling us they love its ability to underpin their graph applications with rock-solid Amazon Web Services (AWS) platforms.
ReGraph is a modern React toolkit with a simple data-driven API, making it quick and easy to add graph visualizations to React applications. And just like KeyLines, our JavaScript toolkit for graph visualization, ReGraph is data-source agnostic.
This means it’s easy to connect to Amazon Neptune and any other database.
AWS developers have a wealth of visualization design and functionality options to choose from when building a graph application that includes our ReGraph visualization component. It’s easy to get overwhelmed by what’s on offer.
This developer tutorial walks you through a simple integration to help you get started. It also showcases one of the many features of ReGraph – the ability to visualize geospatial data.
Let’s begin with an overview of how ReGraph fits seamlessly into the AWS architecture.
AWS & ReGraph architecture
Amazon have published detailed reference architectures for graph databases on AWS. Here, we’ll focus on a simplified version that takes advantage of key AWS technologies.
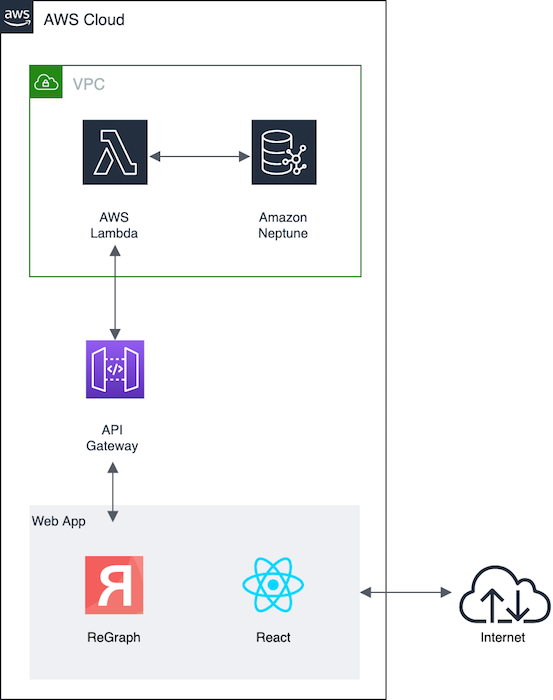
Let’s take a closer look at the technology:
- Amazon Neptune – part of this graph database’s appeal is its ability to work with either W3C’s Resource Description Framework (RDF) queried by SPARQL, or a property graph model queried by openCypher or – as we’ll use in this example – by Gremlin.
- AWS Lambda – this event-driven service runs code and manages resources without the need to build a separate server or handle requests. It’s directly connected to Amazon Neptune, so querying the database is quick and easy.
- Amazon API Gateway – this offers a powerful way to create, publish and maintain APIs that other applications can use. AWS offers more complex ways to expose AWS Lambda to applications (such as AWS AppSync), but the gateway does a good job in our simple application.
- ReGraph – our toolkit for visualizing connected data in React provides a number of fully-reactive, customizable components to embed in your own applications. As you can see, it sits in the front end completely separate from the back end.
- React – Facebook’s modern JavaScript library for creating interactive interfaces means developers working with ReGraph get to use React’s component-based state and data flow management, a Hooks feature for easier coding, efficient rendering and JSX-coded elements with clear syntax.
Before we start configuring our setup, we’ll load our highly-connected dataset.
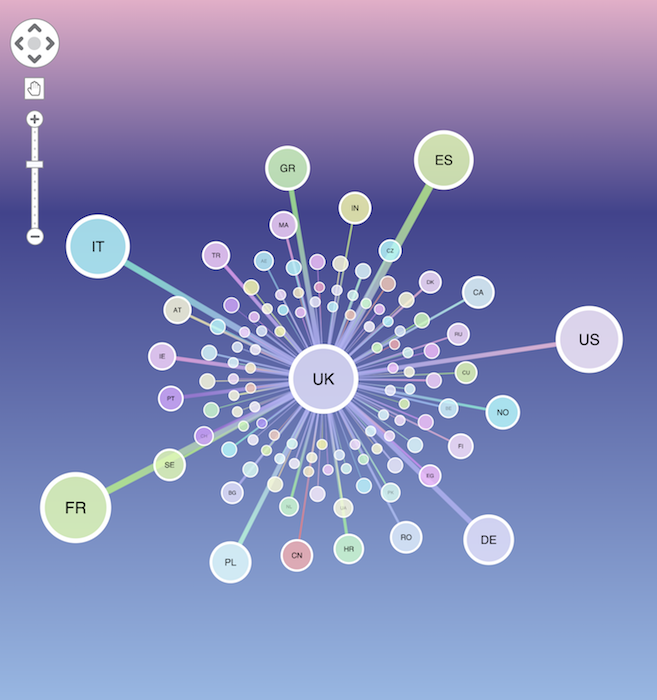
The air routes dataset
We’re visualizing the world airline route data used extensively by Kelvin Lawrence in his excellent Practical Gremlin online tutorial, featuring more than 45,000 routes between over 3,000 airports worldwide.
Loading the data into Amazon Neptune is simple – just follow the step-by-step guide on the AWS Database Blog.
Now we’re ready to get the database talking to our AWS Lambda event service.
Connecting Amazon Neptune to AWS Lambda
AWS recommends that the connection pool size is set to 1, and that all database connections are closed at the completion of your AWS Lambda function. In this example function, we query the database using Node.js 8.10 runtime:
const gremlin = require('gremlin');
const __ = gremlin.process.statics;
const withOptions = gremlin.process.withOptions;
exports.handler = function(event, context, callback) {
  const DriverRemoteConnection = gremlin.driver.DriverRemoteConnection;
  const Graph = gremlin.structure.Graph;
  const endpoint = `wss://${process.env.NEPTUNE_CLUSTER_ENDPOINT}:${process.env.NEPTUNE_PORT}/gremlin`;
  const dc = new DriverRemoteConnection(endpoint, { mimeType: 'application/vnd.gremlin-v2.0+json' });
  const graph = new Graph();
  const g = graph.traversal().withRemote(dc);
  const headers = {
    'Access-Control-Allow-Methods': 'OPTIONS, POST, GET',
    'Access-Control-Max-Age': 2592000, // 30 days
    'Access-Control-Allow-Headers': '*',
    'Content-Type': 'application/json'
  };
  const coreResponse = {
    statusCode: 200,
    headers: headers
  };
  if (event.pathParameters) {
    g.V()
      .has('airport', 'code', event.pathParameters.proxy)
      .outE()
      .inV()
      .path()
      .by(__.valueMap().with_(withOptions.tokens).by(__.unfold()))
      .toList()
      .then(data => {
        const body = JSON.stringify(data);
        const response = { ...coreResponse, body };
        callback(null, response);
        context.done();
        dc.close();
      });
  }
};
Now we have code that can talk to the database. Let’s get the front end talking to the back end.
Configuring ReGraph
To expose ReGraph to the code that talks to Amazon Neptune, we’ll use the Amazon API Gateway.
There’s detailed AWS documentation to get you started with the Amazon API Gateway. Once you’ve configured the right security levels, we can construct a REST endpoint that invokes our AWS Lambda function on demand.
Now we can show how the web application leverages the Amazon API Gateway endpoint to provide data to our ReGraph component. There are several ways to talk to the ReGraph API. We’ll use the Axios helper library with a clean React Hook called ‘useEndpoint’ to ‘hook’ between components. (Special thanks to robinwieruch.de for the inspiration behind this.)
import { useState, useEffect } from 'react';
import axios from 'axios';

const useEndpoint = (URL) => {
  const [data, setData] = useState({ });
  const [url, setUrl] = useState(
    URL
  );
  const [isLoading, setIsLoading] = useState(false);
  const [isError, setIsError] = useState(false);

  useEffect(() => {
    const fetchData = async () => {
      setIsError(false);
      setIsLoading(true);

      try {
        const result = await axios(url);
        setData(result.data);
      } catch (error) {
        setIsError(true);
      }

      setIsLoading(false);
    };

    fetchData();
  }, [url]);

  return [{ data, isLoading, isError }, setUrl];
};

export default useEndpoint;
Hooks were added to React in 16.8.0 and are great for reducing the amount of boilerplate code in your React application. Here’s the code for our basic graph component:
import React, { useState } from 'react';
import { Chart } from 'regraph';

import useEndpoint from './hooks/useEndpoint';
import createItems from './schema/createReGraphItems';

import defaultOptions from './defaults/chartDefaults';

export function Graph() {
  const ID = 'LHR';
  const URL = `https://3d2pdixna0.execute-api.us-east-1.amazonaws.com/query/${ID}`;
  const [{ data, isLoading, isError }, doFetch] = useEndpoint(URL);

  if (isLoading) return 'Loading...';
  if (isError) return `Error! ${isError.message}`;
  let items = {};

  if (data.length) {
    items = createItems(data);
  }
  return (
    <div style={{ display: 'flex', width: '100vw', height: '100vh' }}>
      <Chart
        items={items}
        options={defaultOptions}
        layout={{ name: 'organic' }}
      />
    </div>
  );
}
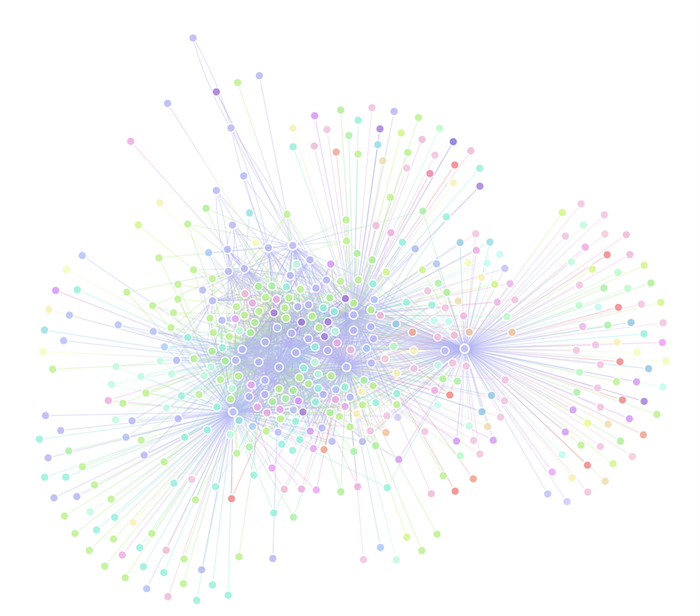
Now we’re almost ready to start visualizing the air routes data.
Visualizing the data in ReGraph
ReGraph has a powerful declarative API. This means we simply provide an object of items (nodes and links) as a prop to the Chart component, and ReGraph renders the chart to the screen.
We have to write some simple code to map the output from the API to the ReGraph node/link format, but we can configure this at the same time as the styles. In this example I’ve written and imported the createItems function to do just that.
Mapping to the ReGraph API is simple because all style properties are human-readable. Here’s an example node:
“ATL”: {
  "color": "rgba(249, 189, 222, 0.8)",
  "coordinates": {
    "lat": 33.6366996765137,
    "lng": -84.4281005859375
  },
  "data": {
    "id": "1",
    "code": "ATL",
    "icao": "KATL",
    "desc": "Hartsfield - Jackson Atlanta International Airport",
    "region": "US-GA",
    "country": "US",
    "city": "Atlanta",
  },
  "label": {
    "text": "ATL",
    "color": "black",
    "bold": true,
    "backgroundColor": "rgba(0,0,0,0)"
  }
}
Notice that there’s data in the “data” object. We’ll refer to this later in our application without having to go back to the API. In our application we’ll use these data to define country and region combos using the data-driven ReGraph API.
Geospatial analysis
Now we’ll bring our connected data to life in the context of a real-world map.
The airports in our air routes data have geospatial coordinates that we’ve mapped to the “coordinates” object in our items. To enable a geospatial layout, we simply set the ‘map’ prop to true.
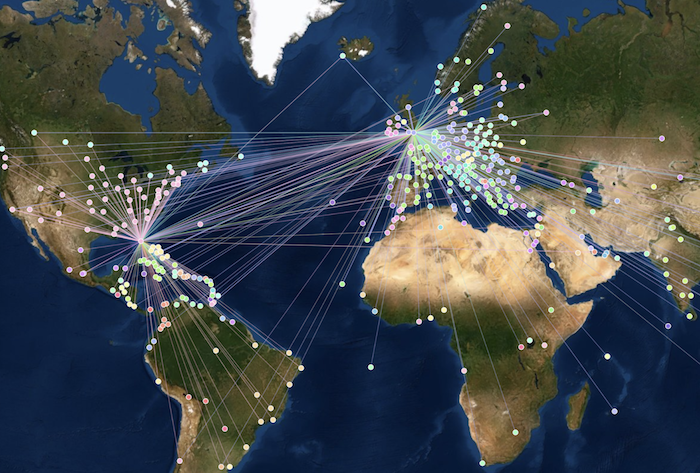
Once they can see network data on a map, users gain a new level of understanding. They don’t have to choose between views though. A smart approach is to visualize the geospatial element alongside the network view and cross-filter each component. With ReGraph, it’s easy to include an additional Chart component to make this happen:
<div style={{ display: 'flex', width: '100vw', height: '100vh' }}>
  <Chart items={items} options={options} layout={{ name: 'organic' }} />
  <Chart
    items={items}
    options={options}
    layout={{ name: 'organic' }}
    onChartClick={clickHandler}
    map
  />
</div>;
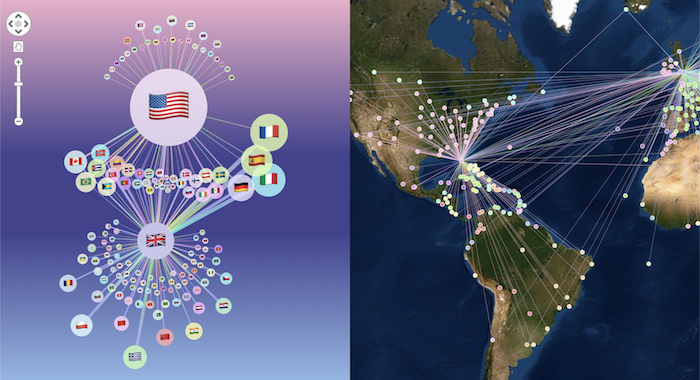
So now we can use our ‘onChartClick’ event to select nodes in the network view on the left to see how they relate to the real-world view on the right, and vice versa:
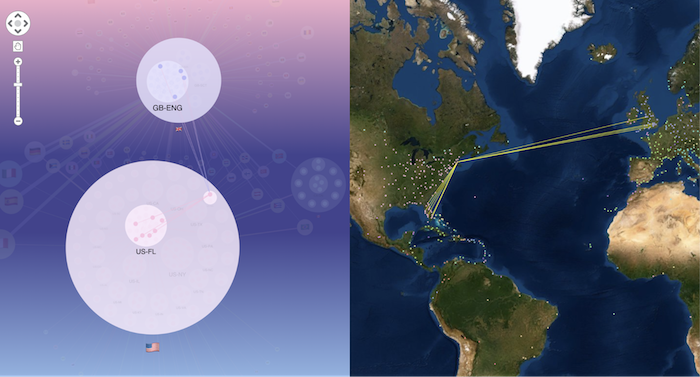
Are you ready for ReGraph?
We’ve shown how easy it is to visualize Amazon Neptune data in ReGraph by integrating with some of the most popular platforms in the AWS stack. If you’re a React developer keen to try ReGraph for yourself, get in touch or sign up for a free trial.
Share:
