Powerful layouts
Reveal hidden insights with beautiful and efficient graph layouts.
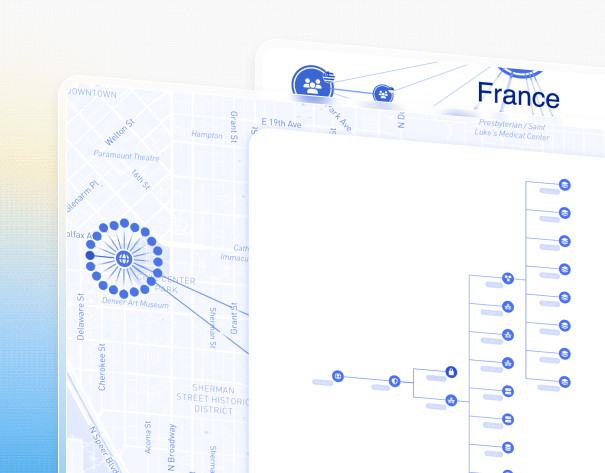
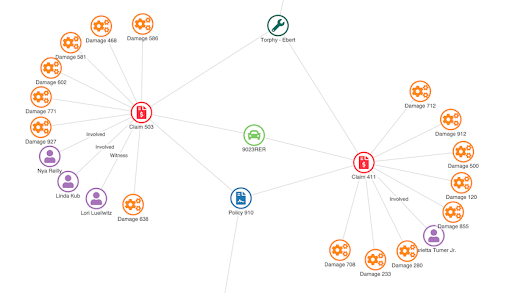
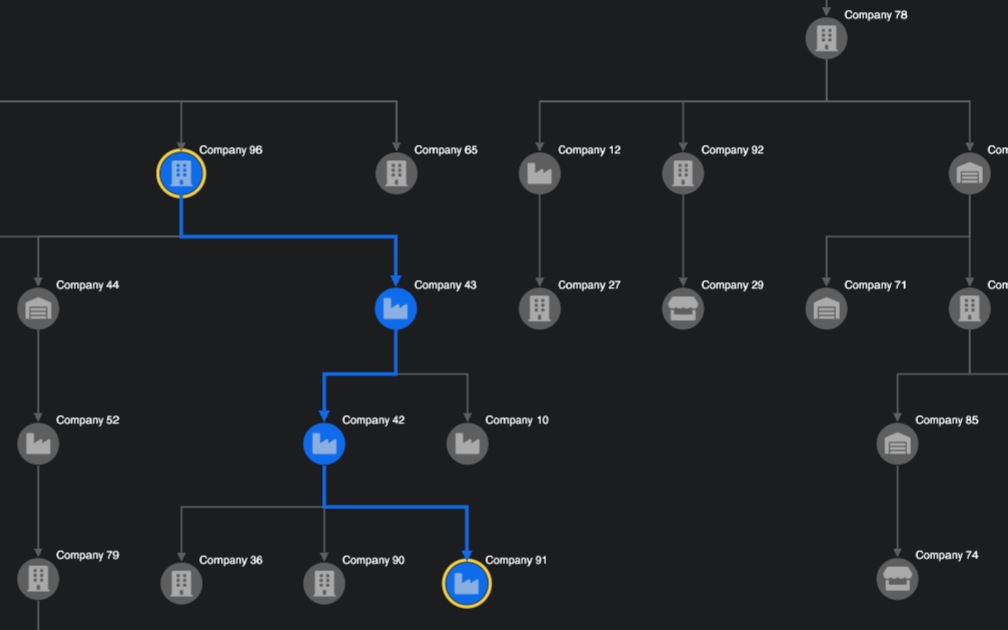
Combo decluttering
Group nodes to spot patterns without overwhelming the chart, then drill down into underlying relationships.
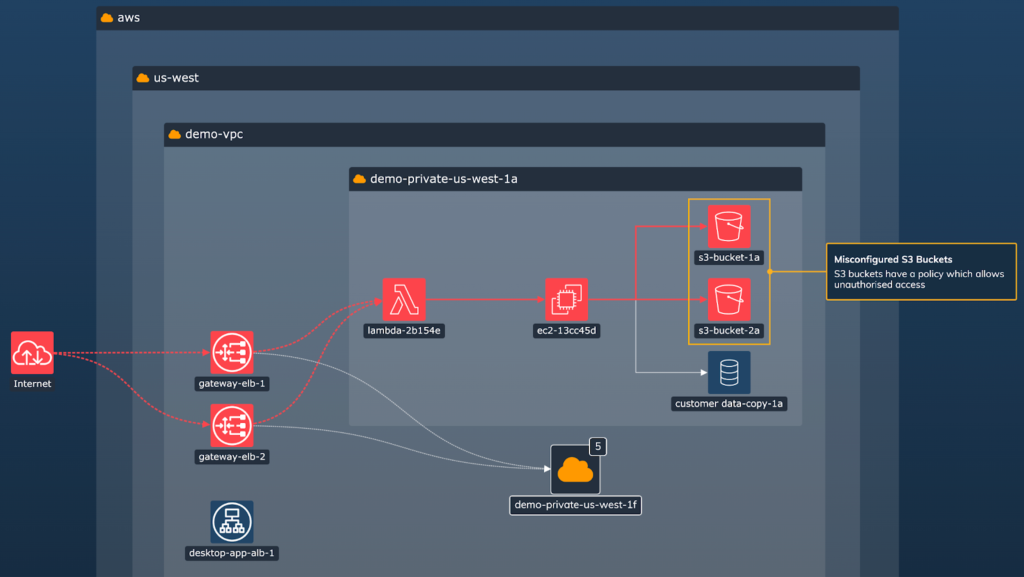
Fully customizable styling
Style nodes, combos, links and annotations to match your application and provide a consistent user experience.
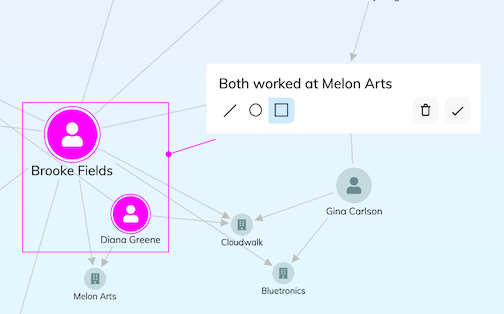
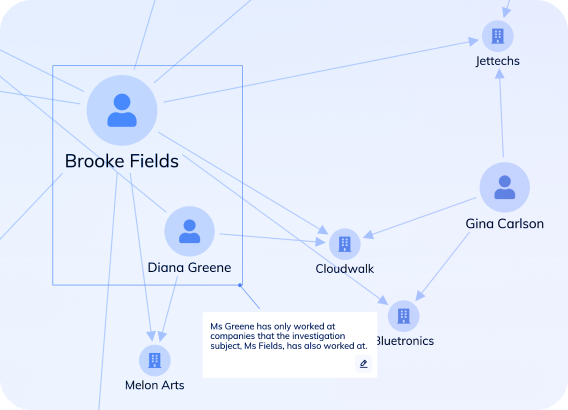
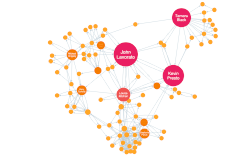
Narrative-building annotations
Narrate, share and export insights with built-in annotations designed for collaboration.
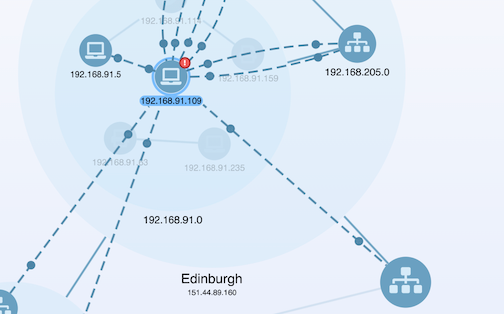
Insight-driven graph engine
Reveal connectivity and data flow using graph centrality and traversal algorithms, and highlight insights through styling, sizing, foregrounding and filtering.
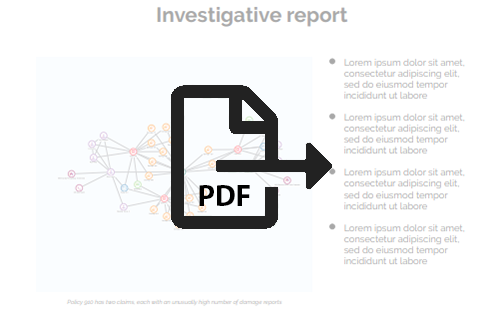
Graph export for reporting
Export charts as PNG, JPEG, SVG or PDF to transition from a live chart to reporting.
Event-driven architecture
Respond to every click, drag and hover to control interactions and build a dynamic chart experience.
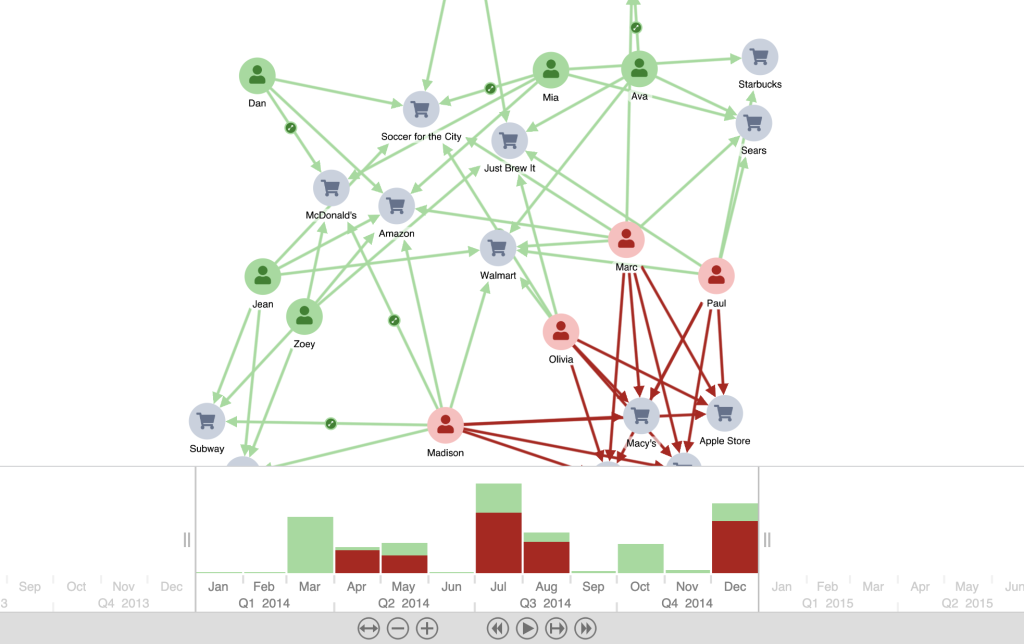
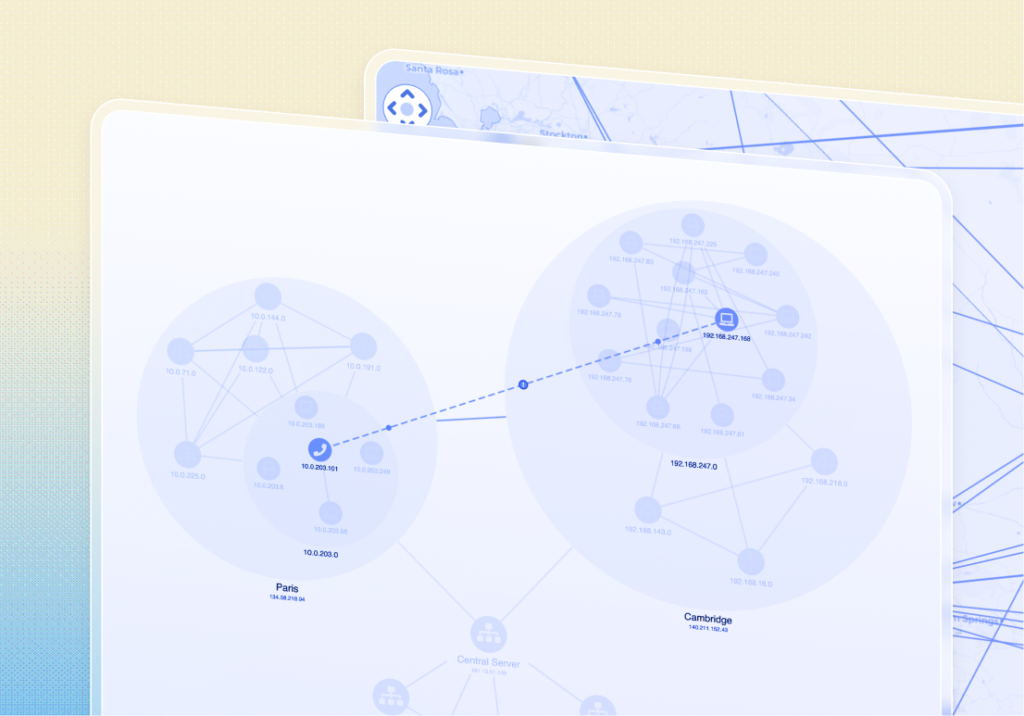
Filtering with the timebar
Filter or explore data by time period to reduce clutter and reveal trends or hidden insights.