
One of the things people love about KronoGraph, our timeline visualization toolkit, is its flexibility. It works with any JavaScript framework and comes with a component that makes dropping it into React applications a breeze.
In an earlier KronoGraph developer tutorial, I wrote about how to create a timeline visualization using the toolkit’s JavaScript API.
This time I’ll use the same dataset (the watches worn by James Bond) to demonstrate how easy it is to build a simple React application from the ground up.
Using our timeline visualization React version
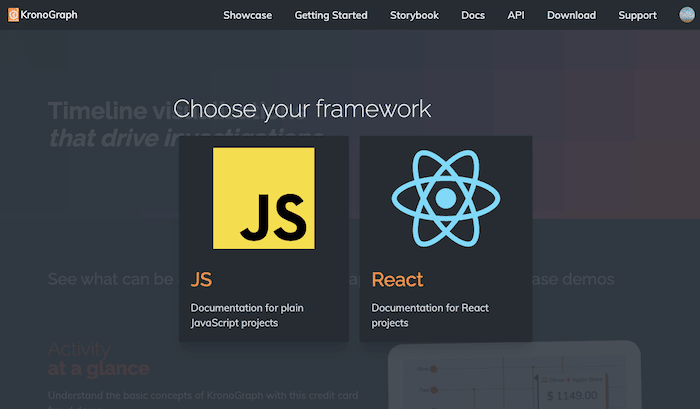
The KronoGraph version we’ll use was designed specifically for React developers. When I log into the SDK site, I select React as my framework. From this point on, the documentation, code snippets and examples I see are React specific.
The simple getting started guide takes me through the process of downloading KronoGraph and importing it into a new application made with Create React App.
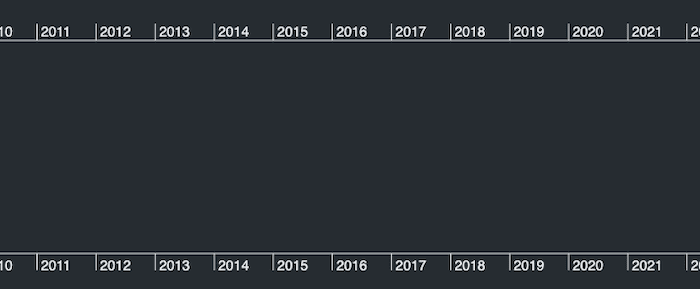
Within a couple of minutes I’ve already created an empty timeline. It’s as simple as adding a <Timeline>
component to my app’s main component.
function App() {
  return (
    <div style={{ height: '100vh' }}>
      <Timeline />
    </div>
  );
}
[widget id=”custom_html-52″]
Loading data into our KronoGraph React app
The React version of KronoGraph expects exactly the same data model as the plain JavaScript version. Read more about the data we’re visualizing here. To visualize the data here, we need to pass two mandatory props (events and entities) and two optional ones (eventTypes and entityTypes).
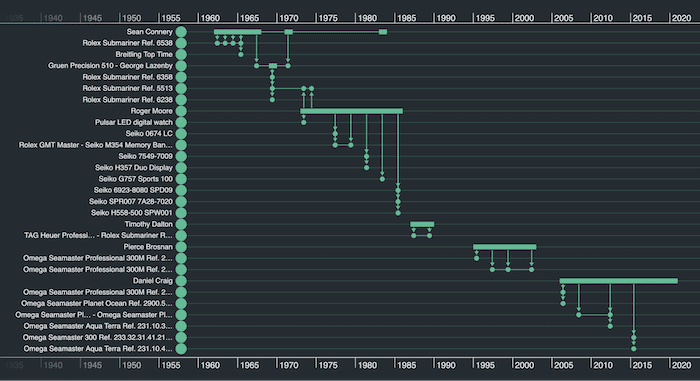
Passing just entities and events gives me the basic dataset.
<Timeline entities={data.entities} events={data.events} />
Now we can bring the data to life by adding entity types and event types to the component, which set the styles we’re going to use for the data.
Styling entities and timelines
With KronoGraph, it’s easy to build a React timeline visualization that looks great and matches your app’s style.
This example entityType entry tells KronoGraph to display all data items of type ‘actor’ using a combination of font icon and coloring.
   actor: {
      color: "#242424",
      fontIcon: {
        text: "uf554",
        color: "white",
        scale: 1.2,
        fontFamily: "Font Awesome 5 Free Solid",
      },
    }
To liven up my timeline, I’ll also pass an options prop to the component. This lets me style the timeline itself. Here’s what I’ll pass to it:
const options = {
    entities: {
      highlightColor: "#F9F4E8",
    },
    focus: {
      backgroundColor: "#F3E0B0",
    },
    backgroundColor: "#F3F3F4",
    scales: {
      textColor: "#242424",
      borderColor: "#242424",
    },
}
And here’s the result:
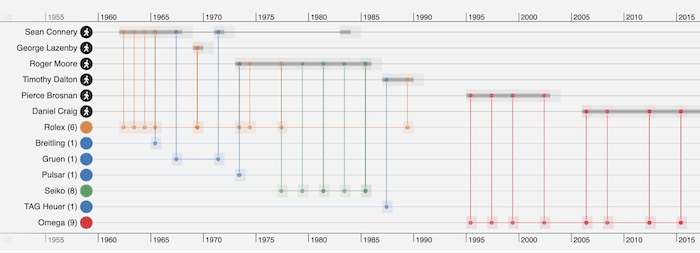
When you double click on a timeline, KronoGraph automatically drills down on that individual timeline and its connections. For investigators working with particularly large datasets featuring many timelines, it gives them the power to quickly identify and analyze key events.
Here, the focus part of the options prop lets me control how items are styled when the user double clicks them. When we double-click Sean Connery, KronoGraph highlights his timeline, making it easier to analyze his relatively modest range of watch choices:
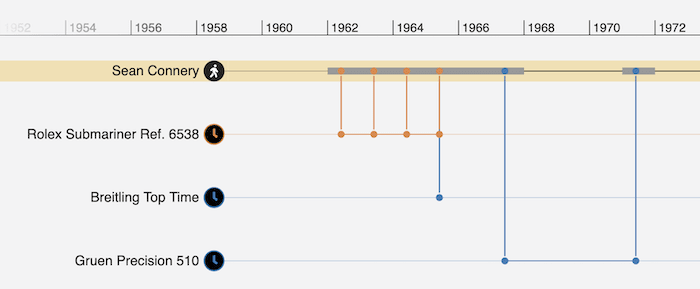
Our timeline visualization React component is fairly simple, but we still benefit from the ability to focus on a specific timeline in this way.
Adding interactions
The React version of KronoGraph comes with the same interaction handlers as its JavaScript counterpart, so you can design interactions that match your user’s investigative workflows. That’s the beauty of a toolkit approach: you get to decide how your app looks and behaves so it fits your particular timeline visualization use case.
If you want to bind to a hover event to generate a tooltip, just add a handler to the relevant prop.
I’ll store my tooltip in state using the useState hook, something like this:
const [tooltip, setTooltip] = useState(null);
Next I’ll write a simple hover handler that updates this state based on the data for the event I’m hovering over.
<Timeline
        entities={entities}
        events={events}
        onTimelineHover={({ id, x, y }) => {
          const event = id === undefined ? null : events.find(ev => ev.id === id);
          if (event) {
            setTooltip({
              data: event.data,
              x,
              y
            }
          } else {
            setTooltip(null);
          }
        }}
      />
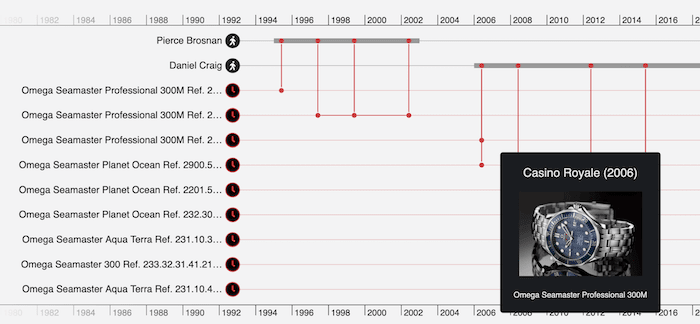
All that’s left is to add a tooltip component to my app which pulls my tooltip definition from state. In our Bond timeline visualization, this brings out key information about the movie that’s stored on the data property of my timeline data.
Create your own React timeline visualizations
I’ve shown how it’s really easy to use KronoGraph in React. Drop in your data and the timeline component will effortlessly adapt to whatever you pass it.
Want to try for yourself? Request a free KronoGraph trial account
Share:
