Interactive timeline tools for joined-up investigations
Andrew Disney Marketing Director
23rd February, 2021 | 4 min read
To build a criminal case, investigators collate information from all sources, revealing an accurate and compelling...
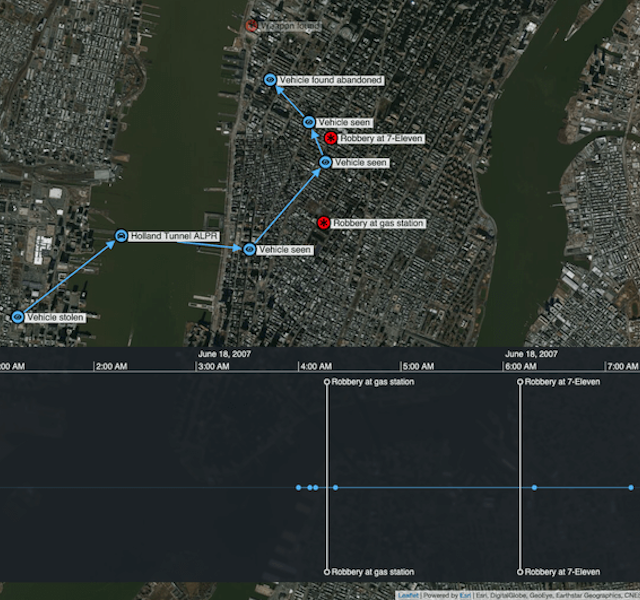
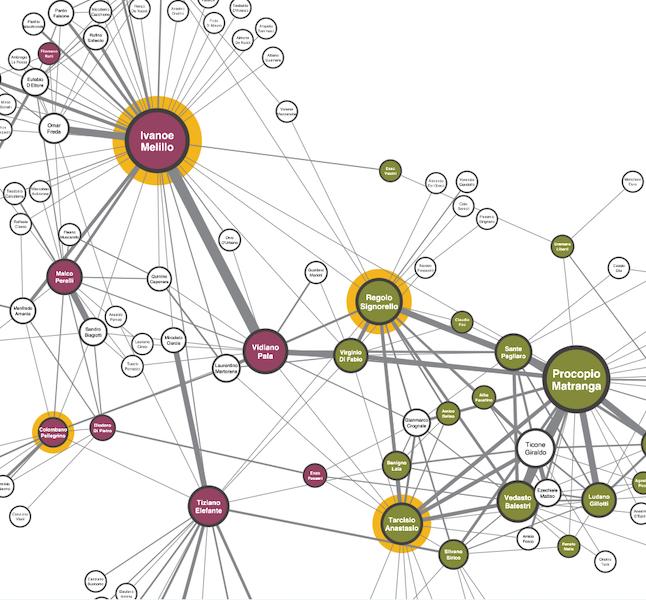
Timeline investigation tools for law enforcement
Andrew Disney Marketing Director
26th January, 2021 | 6 min read
Watch any good (trashy) police drama and you’ll quickly spot a few cliches. The maverick cop (tough, but with a...
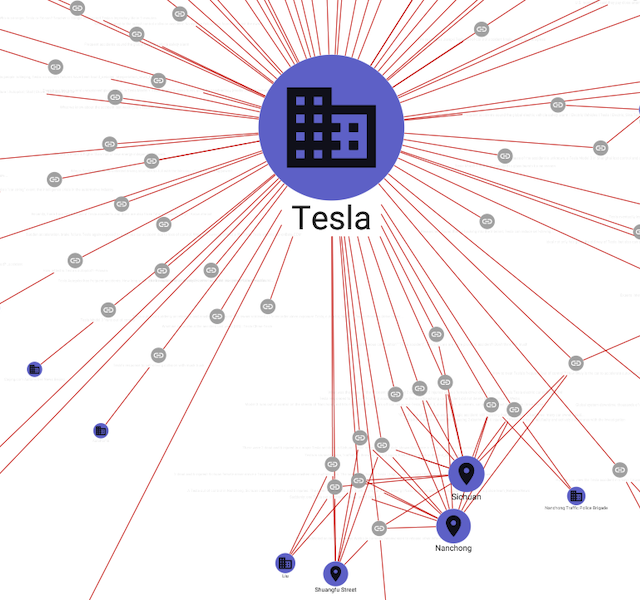
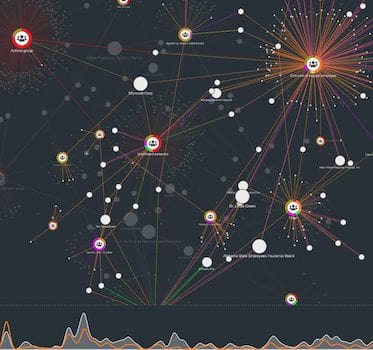
Traversals: powering the intelligence cycle for business
Andrew Disney Marketing Director
5th January, 2021 | 7 min read
See how Traversals combine search, data fusion, translation, and NLP to produce custom knowledge graphs on any...
The ultimate guide to time-based data visualization and analysis
Andrew Disney Marketing Director
24th December, 2020 | 6 min read
Let’s look at the time bar and how it makes visualizing time-based graph data a breeze. We’ll also...

Color theory for data visualization
Andrew Disney Marketing Director
24th November, 2020 | 10 min read
We explore basic color theory, and how carefully-chosen colors can help make your visualizations look good, and...
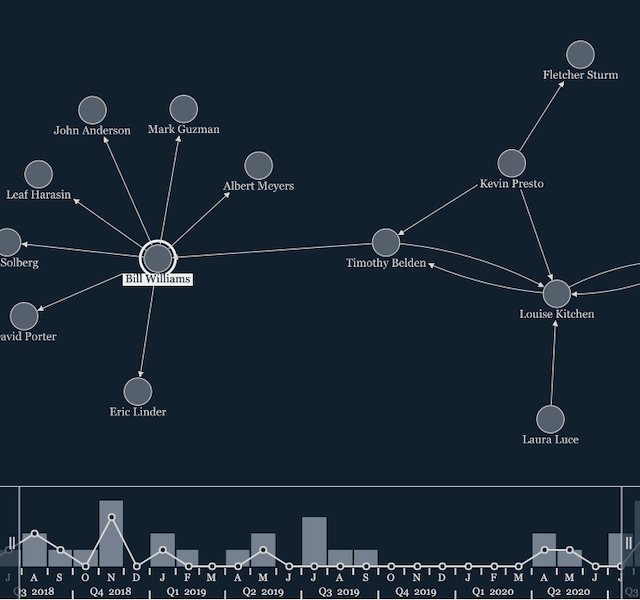
Dynamic network visualization methods explored
Andrew Disney Marketing Director
18th November, 2020 | 8 min read
In this updated post, we explore popular dynamic network visualization methods, and look at how our data...
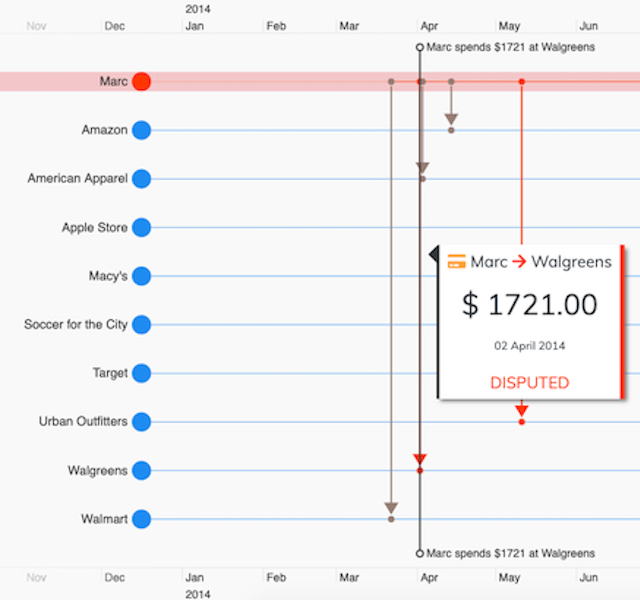
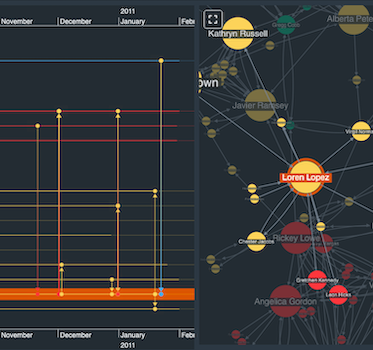
Insider trading detection using timeline visualization
Andrew Disney Marketing Director
29th September, 2020 | 6 min read
Building timeline visualization tools for fraud investigations, using the KronoGraph timeline visualization...
Cambridge Intelligence announces KeyLines 6.0
Andrew Disney Marketing Director
21st July, 2020 | 2 min read
Cambridge Intelligence today released a major new version of KeyLines, the industry-leading graph visualization...
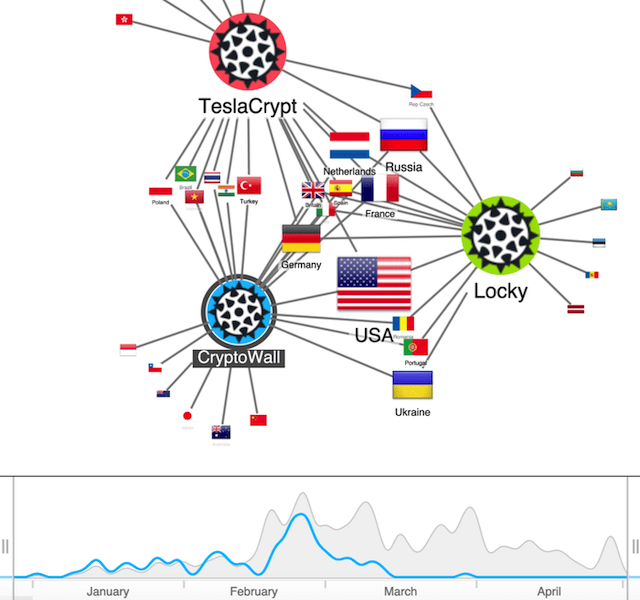
Data breach visualization: exploring cyber security graphs
Andrew Disney Marketing Director
20th April, 2020 | 6 min read
Visualizing the VERIS community database of data breaches: How graph visualization can help us extract insight...
