
The challenge of dynamic network visualization has kept academics and data scientists busy for years. We’ve covered why you should visualize networks before.
But how do you give users the ability to filter and summarize time-based, complicated connected data without overwhelming them?
What’s the clearest, most intuitive way to reveal how events unfold?
And what if the time element holds the insight that unlocks everything else?
While building the time bar – our component for visualizing dynamic networks – we spent a lot of time appraising the existing time-based visualization options available.
Let’s explore some of the most popular dynamic network visualization methods. We’ll see how the time bar evolved, and what makes it so effective. We’ll also take a look at the next generation in dynamic visualization: KronoGraph, the timeline visualization toolkit.
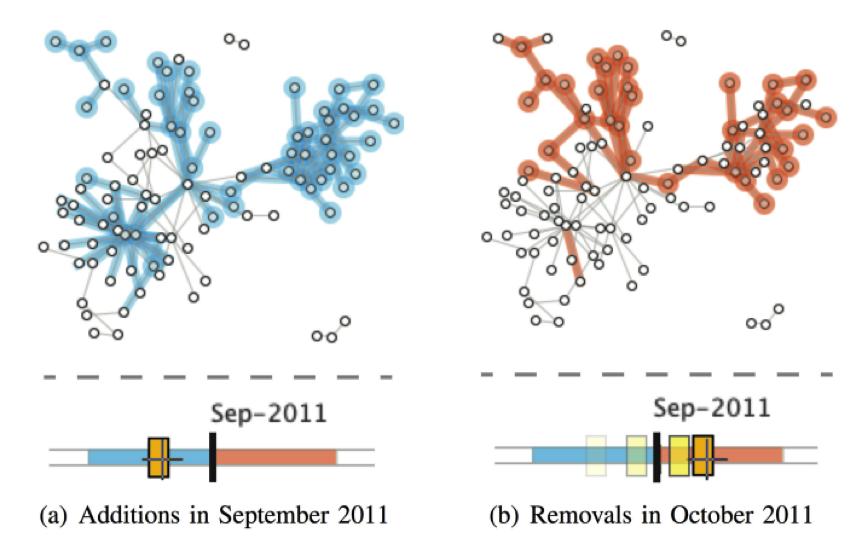
Approach 1: Small Multiples
This is a common way to represent the evolution of a network. It generally involves taking snapshots of the network at different points in time, and comparing them side-by-side:
The small multiples approach can be enhanced with some animation (like a flick-book) and using visual effects to highlight nodes and links joining or leaving the network.
This example shows new chart entities in green and expiring ones in red. It feels more like a ‘spot the difference’ puzzle than intuitive network visualization. Its value is limited by the time it takes to cross-reference between versions, and the lack of granularity.
Approach 2: Time slices
A more sophisticated option is to create time slices of the network and present them all together, with nodes connected across the slices:
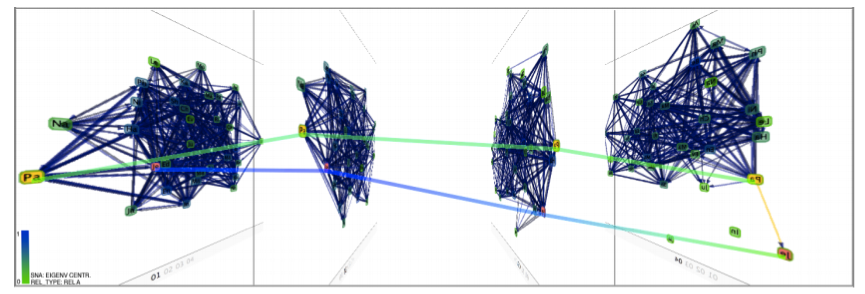
This method makes it easier to track the progress of individual nodes, but unfortunately, we’re back to 3D networks. Topologies become very distorted in this view, making wider trends almost impossible to find. This example also uses labeling, which goes some way to improving the readability… but not much.
Approach 3: GraphDiaries
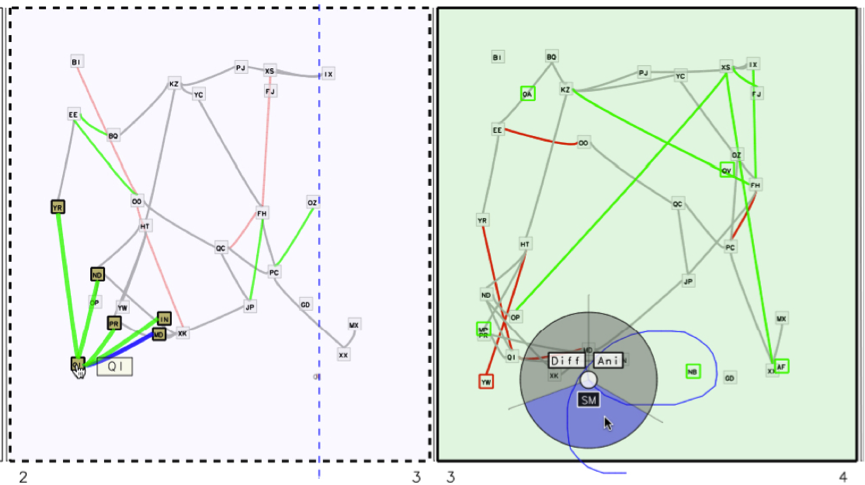
This approach uses color-coding to represent nodes as they appear and disappear. It can be challenging to work with, but it gets bonus points for keeping time and network both in a single view – something we were keen to do with the KeyLines and ReGraph time bar.
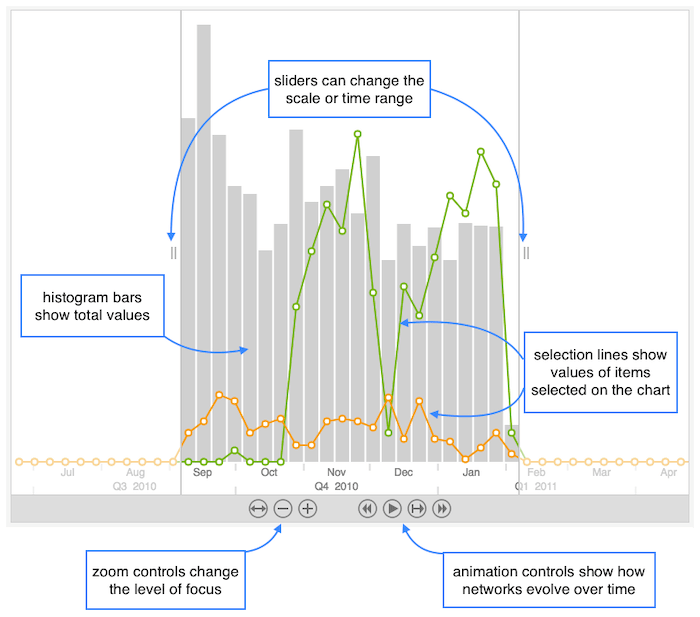
Approach 4: Time Slider
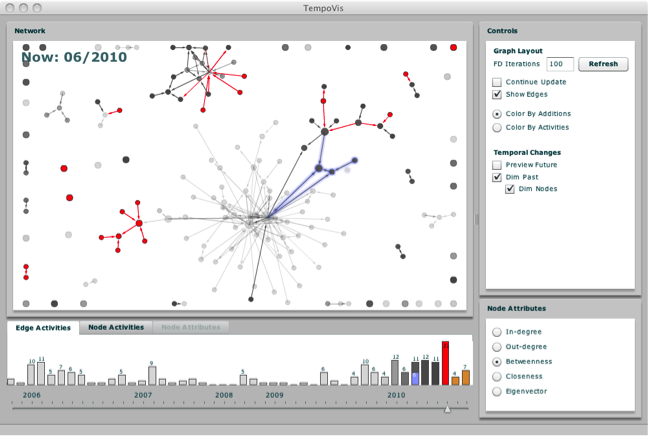
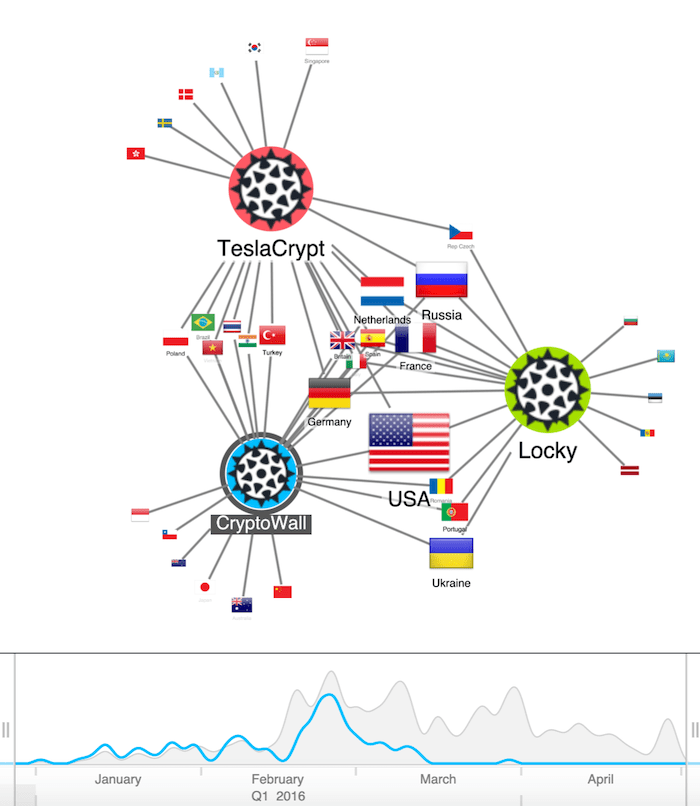
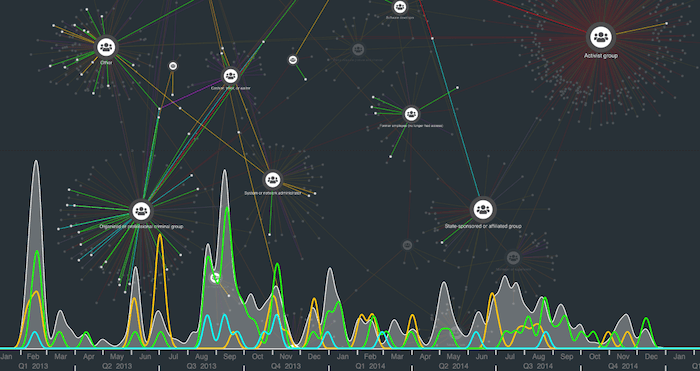
This is one of the more advanced approaches. It combines a time slider, histogram and color-coding. The color of the histogram bars corresponds with the colors on the network chart, and the user navigates through time with a slider along the bottom of the screen. Some elements of this design are very intuitive: the node-link network, and the histogram with time slider. And the user can observe network changes without having to cross-reference between different screens.
Academic approaches to dynamic network visualization
Now let’s look at some creative approaches from the world of academia. They’re largely developed for specific ‘niche’ datasets, so they don’t translate well to other use cases. But they’re all interesting in their own right.
1. Tree Rings
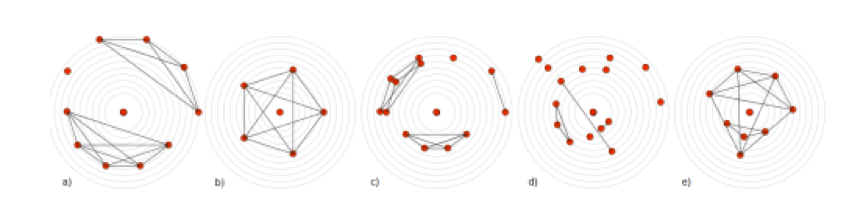
Farrugia, 2011 [PDF]
This approach moves away from representing networks in a force-directed layout, instead showing nodes and links displayed across a series of time rings. It brings the time-based element of the data to the foreground, and users understand the evolution of the data through its shape. It’s certainly unique, but probably not intuitive enough for most users.
2. 3D layers
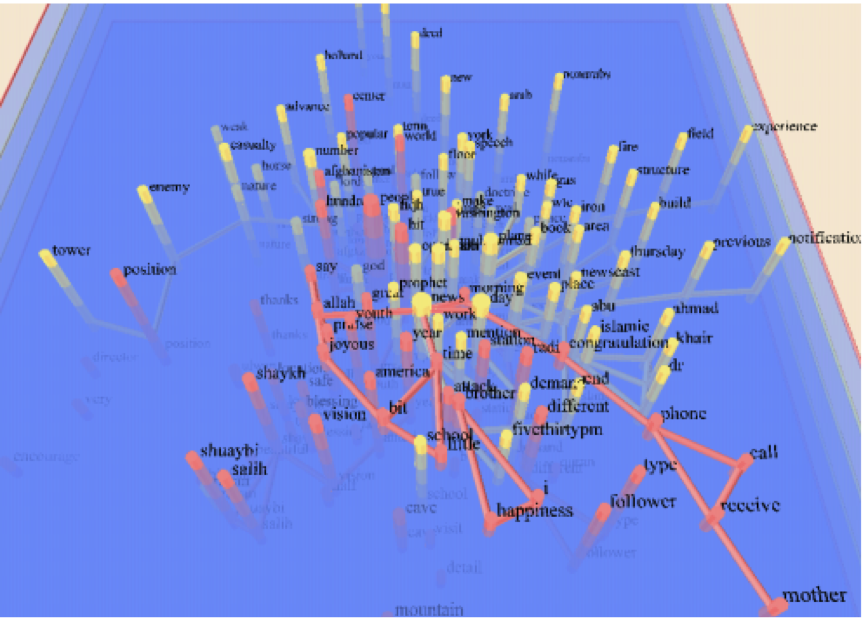
This approach overlays incremental network charts so the user can observe differences with each layer. It removes some of the challenges of other time slice approaches, but quickly gets complex.
3. Consecutive Matrices
You probably know how a matrix can be used to represent a network: nodes along the X&Y axis, with the corresponding cell filled if a relationship is present. This approach generates multiple matrices for comparison. It’s not much more simple than other approaches – and it adds further complication by removing the intuitive node-link model.
4. Gantt charts and Sankey diagrams
If you’re handling time-based data, these specialist visualizations help to portray how connections and dependencies evolve.
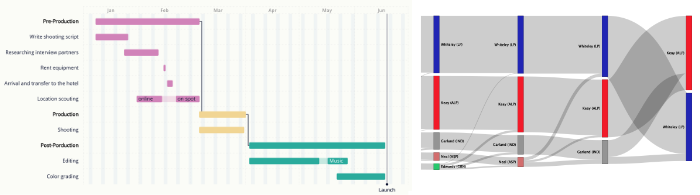
Gantt charts & Sankey diagrams
The drawback with such an aggregated view is that you only see a high-level picture and don’t get to drill down into the detail. Gantt charts and Sankey diagrams are fixed images. They lack the dynamic quality users get from an interactive visualization experience.
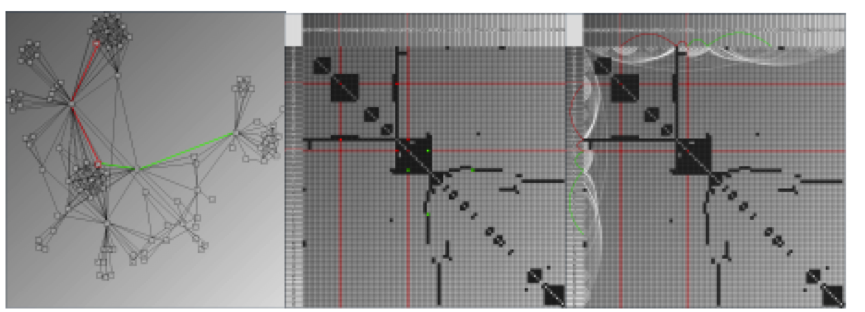
5. The data viz mashup
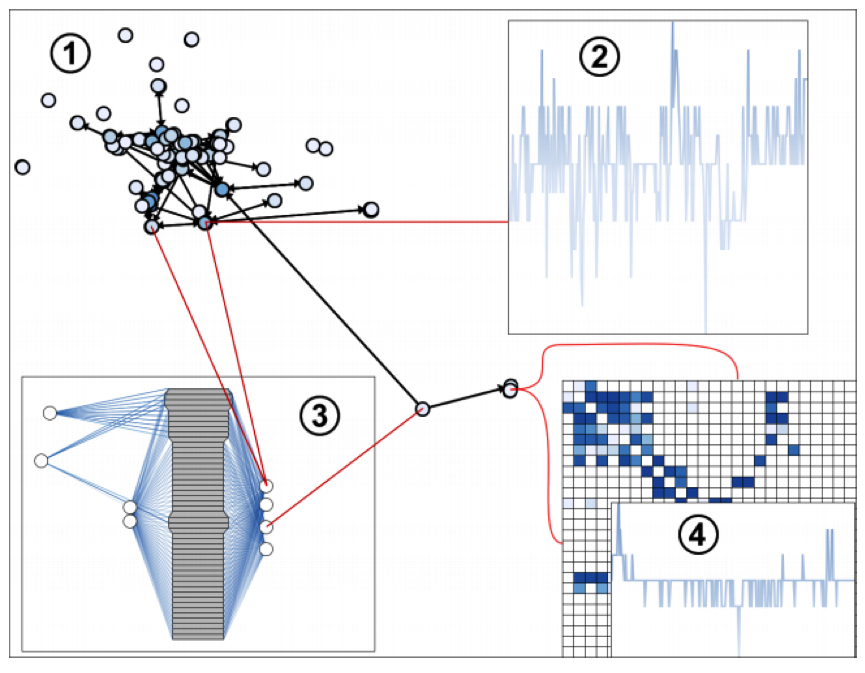
Hadlack, 2011
If you can’t find a single perfect approach that works for you, why not combine several? The only drawback is splitting the audience’s attention between multiple charts. That’s a lot of information coming from a lot of different angles.
Our dynamic network visualization approach
After much debate, design and development, we settled on a hybrid approach combining small multiples, animation, area plots, histograms and a time slider.
We landed on a design that’s clear, clean and intuitive. Users can view network and sub-network trends in a single component, with simple controls for filtering and navigation:
Stacked bars in your time bar’s histogram show how different types of activity evolve, while area plots give a more fluid display of what’s happening in the network:
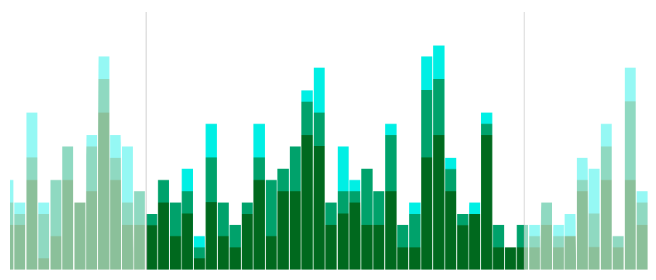
The time bar is fully integrated with the network chart. Users can explore chart items and watch the time bar update, or filter events in the time bar to drive changes in the chart. There are also animation controls to reveal data evolution.
A new era in visualizing time-based data: KronoGraph
We’ve seen how the time bar gives users a powerful way to filter and summarize the time-based data in their networks. It’s one of the key features of our graph visualization toolkits.
We also recognized the need to give investigators a new way of understanding how events unfold over time, so we created KronoGraph. It’s a toolkit for building fully interactive timeline visualizations directly from your data.
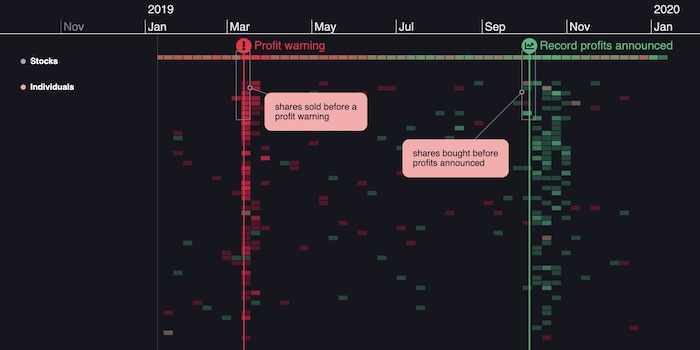
Timelines transition smoothly and look good at every scale – from a single event to an aggregated heatmap view of thousands.
You can even integrate it with ReGraph or KeyLines to explore your graph data from different perspectives:
Visualizing dynamic data the smart way
If you’ve tried some or all of these creative options, you’re probably ready for a tool that offers a fully interactive way to analyze your time-based data.
Our time bar functionality makes it easy to focus on specific time periods in your connected data, compare activity or spot trends and outliers.
If you need to take time-based investigation one step further, our KronoGraph SDK offers fully-scalable timeline visualizations that reveal how events unfold.
Find out more
Need help visualizing your dynamic networks? Get started with our toolkits and find out what you can achieve. Sign up for a free trial
Share:
