
If you’re searching for the right toolkit to build a Cosmos graph visualization web application, we have the two strongest contenders.
Our KeyLines toolkit gives JavaScript developers the flexibility to code however they like, while our ReGraph toolkit is specifically designed for React developers. What they both have in common is the ability to work with whatever data source you want.
![]()
Azure Cosmos DB is Microsoft’s globally distributed, multi-model database service for building high performance, planet-scale applications. We know that developers love its native support for NoSQL, giving them the flexibility to develop their own applications easily.
In this developer tutorial, we’ll demonstrate how to connect a graph visualization application, built with our toolkit technology, to an Azure Cosmos DB graph database. Using Microsoft’s implementation of the TinkerPop 3.4 Gremlin API standard, we’ll give you full integration code for both KeyLines and ReGraph, so you’ll be creating Cosmos visualizations in no time.
Nobel Prize data
Data from the official Nobel Prize website features details of every award since the first ceremony in 1901. Those awarded a prize become Nobel Laureates in recognition of advancements in physics, chemistry, medicine, literature, peace or economic sciences.
We’ve gone for a simple schema, where links connect nodes representing prizes, Laureates, the Laureate’s country of birth, and the research projects or organizations Laureates were affiliated with. We’ve also created properties for the age and gender identities of each laureate, as well as the year the prizes were awarded.
Download the toolkit
As well as access to Cosmos DB, you’ll need KeyLines or ReGraph to follow this tutorial. To get started, simply request a free trial.
Configure an express server
To start, we’ll set up an express server with a connection to our Cosmos DB database.
The server forwards requests from our app to Cosmos DB, and sends back the received data. It’s simple to configure using the gremlin npm module. We’ll also enable Cross-Origin Resource Sharing (CORS), and remember to update the URL to match the domain and port you’ll make requests from:
const { flatten } = require('lodash');
const gremlin = require('gremlin');
const express = require('express');

const app = express();

const config = {
  endpoint: '',
  primaryKey: '',
  database: 'nobel-prize',
  collection: 'nobel-prize',
};

app.use(function(req, res, next) {
  res.header("Access-Control-Allow-Origin", "http://localhost:3000");
  next();
});
Use a Gremlin query to find all the prizes belonging to one of the listed categories, and the Laureates with links directed towards these prizes. From those Laureates, we then find the institutions, prizes, or countries of birth they’re connected to. The final step collects every node and link visited during this graph traversal.
const queryTemplate = (categories) =>
  `g.V().has('type', 'prize').has('category', within(${categories})).inE().outV().outE().inV().path()`;

const authenticator = new gremlin.driver.auth.PlainTextSaslAuthenticator(
  `/dbs/${config.database}/colls/${config.collection}`,
  config.primaryKey,
);

const gremlinClient = new gremlin.driver.Client(config.endpoint, {
  authenticator,
  traversalsource: 'g',
  mimeType: 'application/vnd.gremlin-v2.0+json',
});

app.get('/cosmosdb', async (req, res) => {
  const categories = req.query.categories.split(',').map(category => `'${category}'`).join(',');
  const template = queryTemplate(categories);
  const response = await gremlinClient.submit(template, req.query);
  res.send(flatten(response._items.map(item => item.objects)));
});

app.listen(3456);
Configuring your Cosmos visualization application
With Cosmos DB doing the hard work, we can keep our request from the frontend pretty simple.
In the query parameters of our request, we specify which categories of prizes to include (i.e. any number from physics, chemistry, medicine, literature, peace and economic sciences).
Follow instructions for whichever toolkit you’re using: ReGraph or KeyLines.
Using ReGraph
Enter:
function regraphFormat(objects) {
  const items = {};
  objects.forEach((object) => {
    items[object.id] = object.type === 'vertex' ? regraphNode(object) : regraphLink(object);
  });
  return items;
}

function regraphNode(vertex) {
  const type = vertex.properties.type[0].value;
  const node = { data: { type }, label: { text: vertex.id } };
  if (type === 'laureate') {
    node.data.gender = vertex.properties.gender[0].value;
  } else if (type === 'prize') {
    node.times = [{ time: new Date(vertex.properties.year[0].value) }];
    node.data.prizeType = vertex.properties.category[0].value
  }
  return node;
}


function regraphLink(edge) {
  return {
    label: { text: edge.label },
    end2: { arrow: true },
    id1: edge.outV,
    id2: edge.inV,
  };
}
In this code, fetchData takes an array of our Nobel Prize categories:
async function fetchData(categories) {
  const response = await fetch(`http://localhost:3456/cosmosdb/?categories=${categories}`);
  const items = await response.json();
  return regraphFormat(items);
}
Now the frontend and backend can talk to each other, we’re ready to load the Nobel Prize data into the chart.
Using KeyLines
Enter:
function keylinesFormat(objects) {
  return {
    type: 'LinkChart',
    items: objects.map((object) => {
      return object.type === 'vertex' ? keylinesNode(object) : keylinesLink(object);
    }),
  };
}

function keylinesNode(vertex) {
  const type = vertex.properties.type[0].value;
  const node = { type: 'node', t: vertex.id, id: vertex.id, d: { type } };
  if (type === 'laureate') {
    node.d.gender = vertex.properties.gender[0].value;
  } else if (type === 'prize') {
    node.dt = new Date(vertex.properties.year[0].value);
    node.d.prizeType = vertex.properties.category[0].value;
  }
  return node;
}


function keylinesLink({ id, outV: id1, inV: id2, label: t }) {
  return { id, t, id1, id2, type: 'link', a2: true };
}
In this code, fetchData takes an array of our Nobel Prize categories:
async function fetchData(categories) {
  const response = await fetch(`http://localhost:3456/cosmosdb/?categories=${categories}`);
  const items = await response.json();
  return keylinesFormat(items);
}
Now the frontend and backend can talk to each other, we’re ready to load data into the chart.
Loading the Nobel Prize dataset
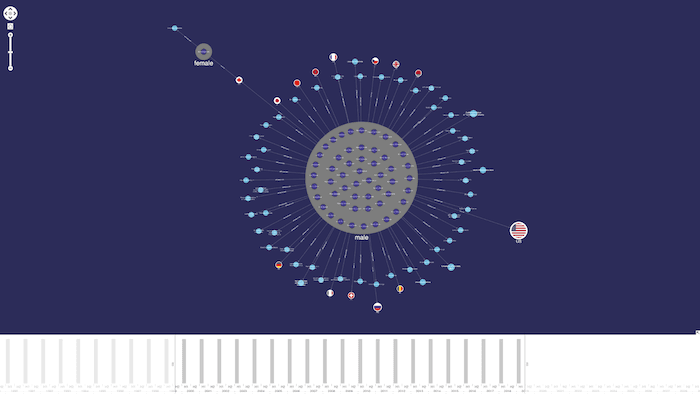
Visualizing the entire dataset – all 597 prizes and 950 Laureates – gives us a sense of its overall shape. In our Cosmos visualization we’ve sized countries and institutions based on how well connected they are using eigencentrality, one of our advanced social network analysis algorithms.
We’ve used our force-directed organic layout, one of many automatic layouts available, to position larger components at the center so they’re easier to spot.
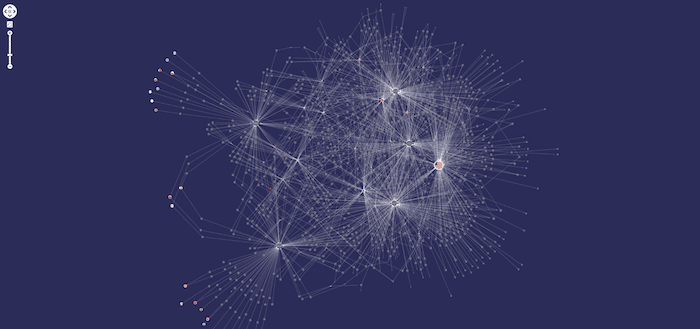
Instinctively, an analyst may zoom into highly-connected nodes first. It’s immediately clear that the USA is a major influence.
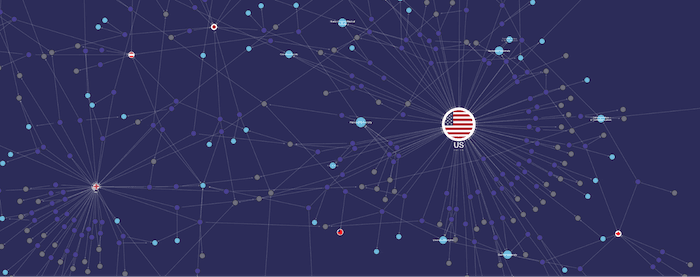
Filtering by time
Analysts want to know how data evolves. The time bar in our toolkits lets you filter dates and times in an intuitive way.
Filtering the dataset declutters our Cosmos visualization, making it easier to focus on the details and discover interesting patterns.
Looking at the data since 2009 reveals which institutions were the bridges connecting Laureates born in different countries. Interestingly, the LIGO/VIRGO scientific collaboration provides a connection between researchers born in Germany and the USA.
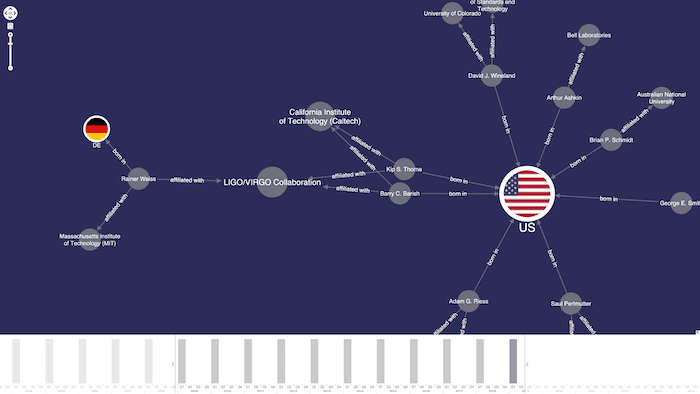
And Bell labs connects researchers from the USA and Canada:
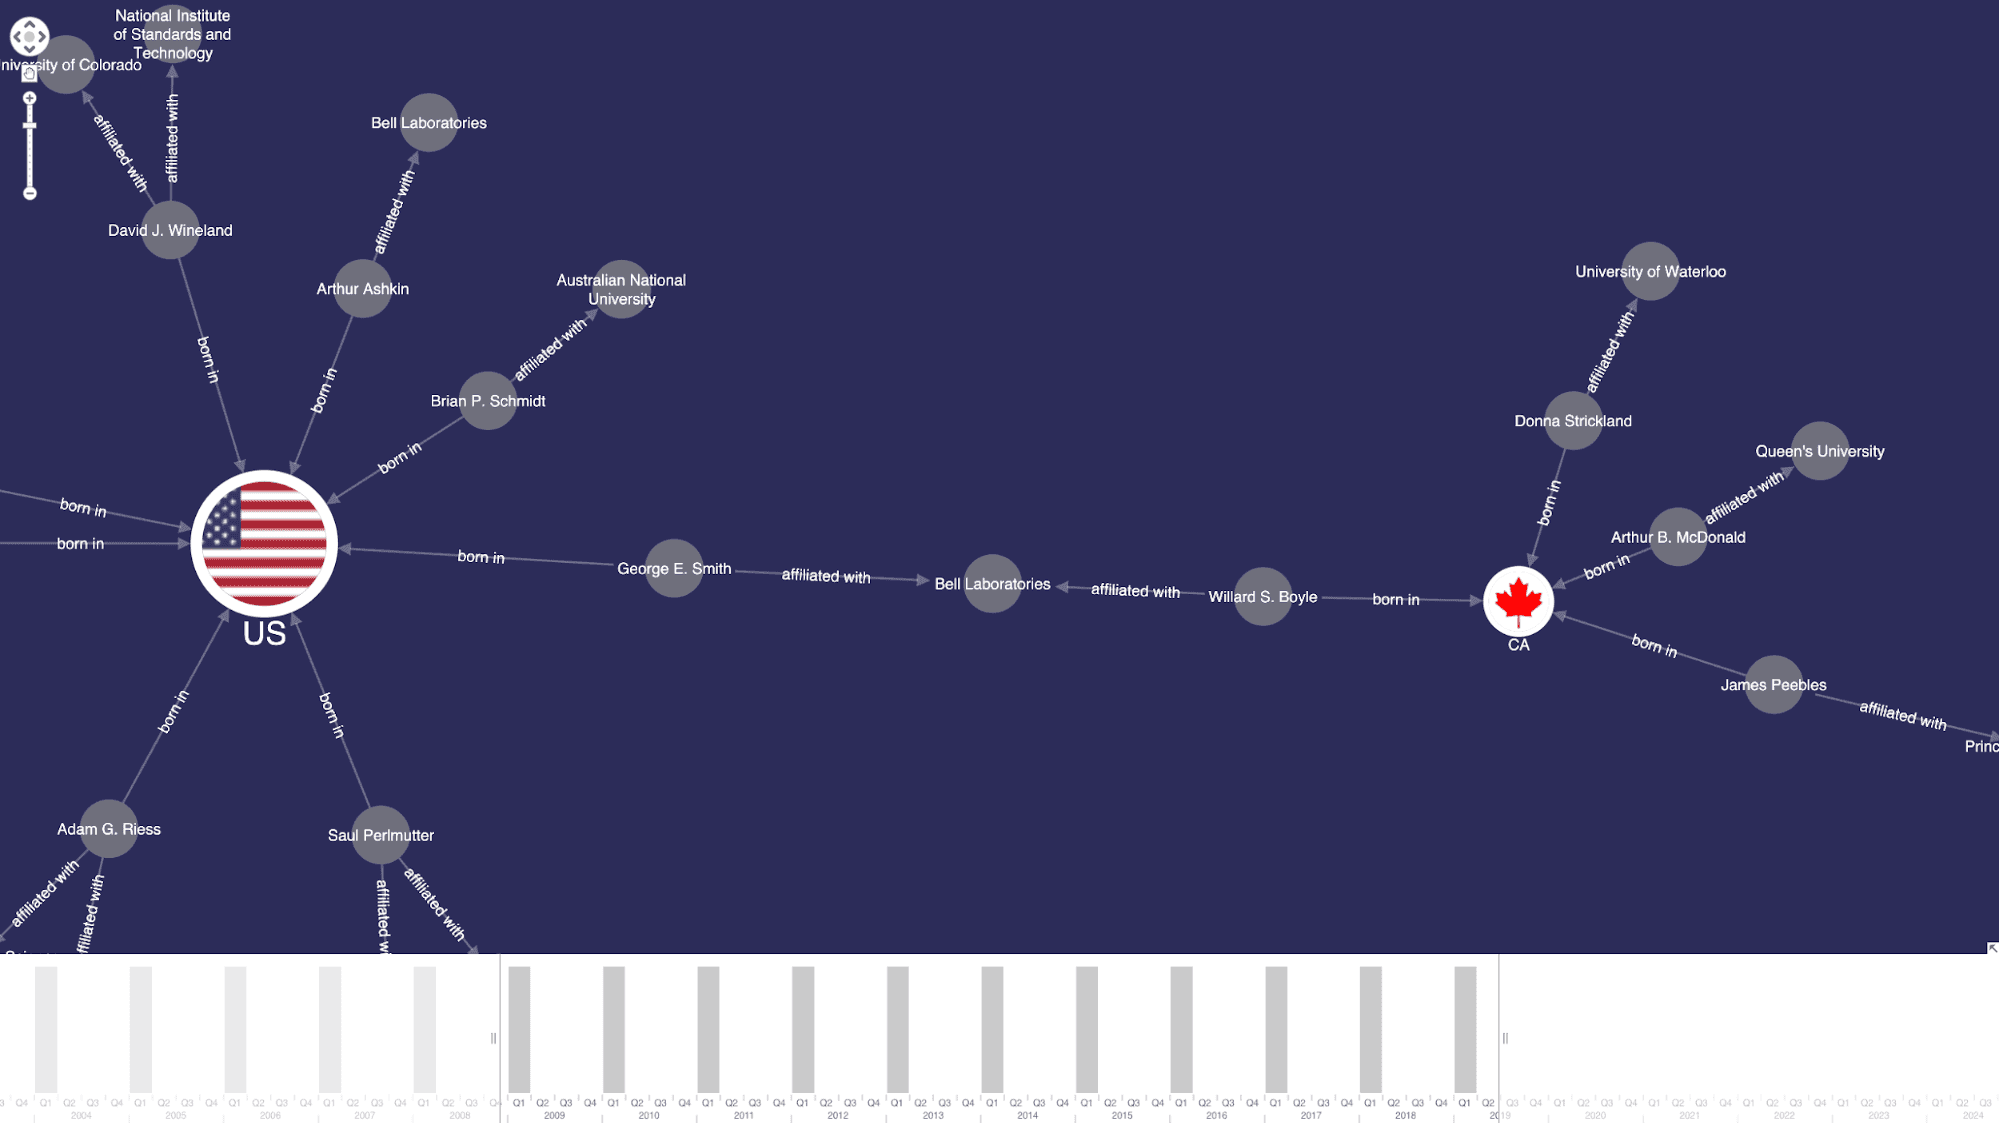
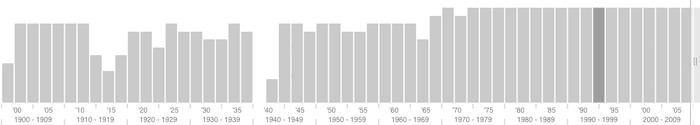
The gray histogram bars represent levels of activity over time. As the Nobel Prizes are awarded once every year, we see a regular annual pattern.
Further back in time we can see lower levels representing years when, for various reasons, fewer or no prizes were awarded.
Grouping common nodes using combos
Our combos feature lets you group nodes that belong to a subnetwork or share a common characteristic.
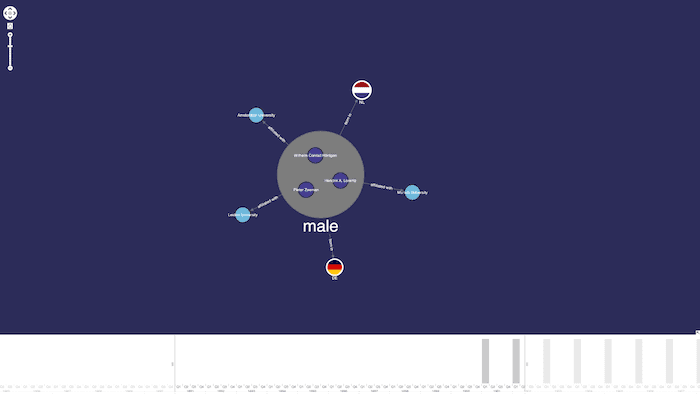
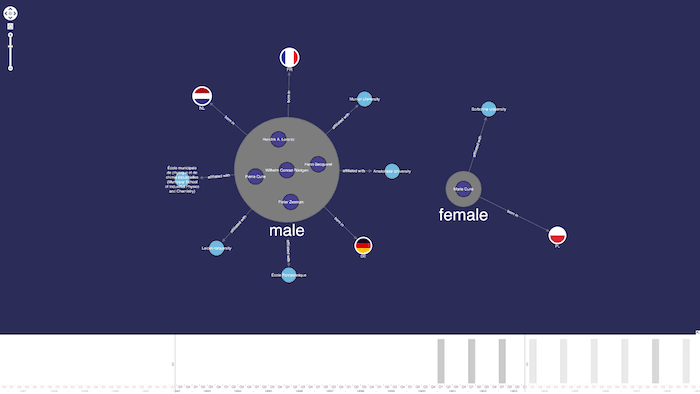
If we combine Laureates by gender identity and look at the earliest physics awards, we can see they all went to men:
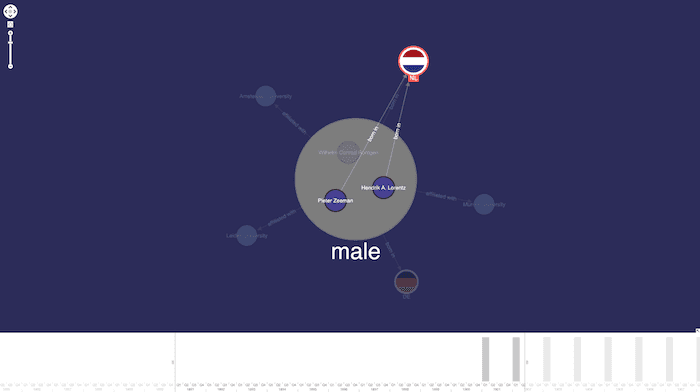
Combos aren’t just for high-level analysis – they can reveal detail on demand. If we click on the Netherlands flag, the connections to Laureates born in that country are brought to the foreground.
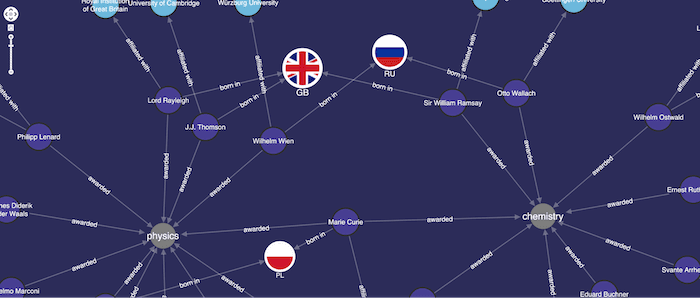
When we expand the time range, we see the first physics prize awarded to a woman: Polish national, Marie Curie, for her pioneering research on radioactivity.
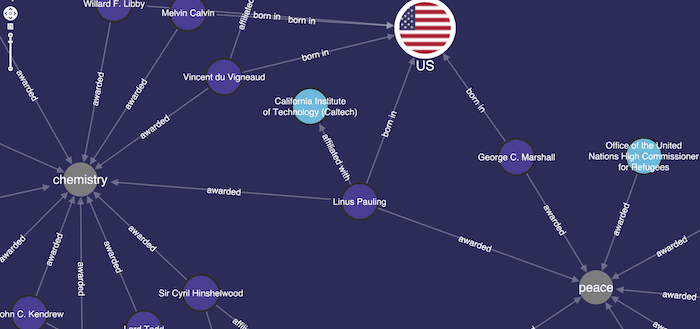
Analyzing connections reveals that Marie Curie was awarded Nobel Prizes in two different fields – physics and chemistry.
The only other person to achieve this is the American, Linus Pauling, in chemistry and peace:
In recent years, the physics prize has been dominated by men, with only one award going to a woman in the last 20 years. That was Donna Strickland for the invention of chirped pulse amplification.
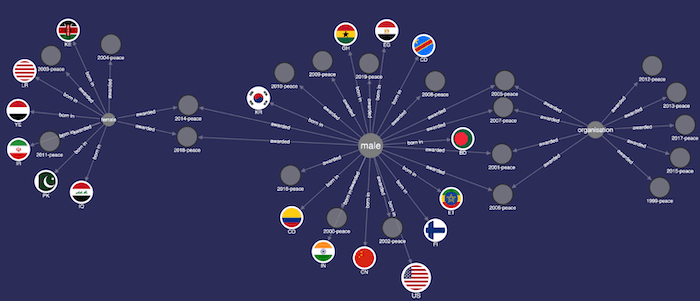
Finally, the Nobel Prize for peace is noticeably more diverse when it comes to gender identity and country of birth. These are for prizes awarded since 2000. Notice that peace prizes can be awarded to organizations, not just individuals.
Get started with our toolkit technology
With quick and easy integration, integrating Azure Cosmos DB with KeyLines or ReGraph delivers the powerful Cosmos visualization application your users deserve. We’ve looked at just a few of the features that’ll help bring your data to life, but there’s more to discover. Check out our downloadable resources for more details.
Ready to try our award-winning toolkit technology? Simply request a free trial, or feel free to contact us to talk about how we’ll meet your graph visualization needs.

Share:
