
Performance is key when you’re building a graph visualization product. No matter what browser or device your application runs on, large, complex datasets shouldn’t take ages to load, and chart interactions must be smooth and responsive.
But performance isn’t a standalone feature. It’s a key contributor to one of the most important goals of your application design: good user experience.
We’ve worked hard to deliver the most powerful network visualization toolkits so your users get the fast and insightful experience they deserve. What makes the performance rates so impressive? It’s all thanks to the Web Graphics Library (WebGL).
In this post, we focus on WebGL: what it is, how it works, why it’s important to UX, and how we’ve recently improved the performance of our toolkit technology by 50%.
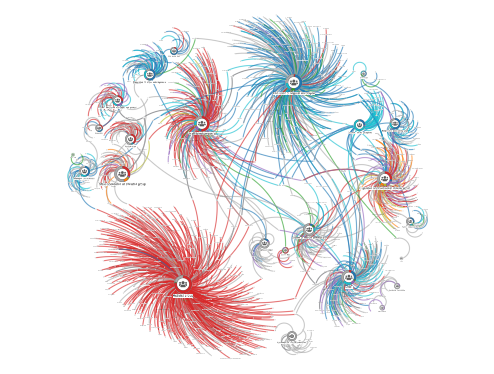
Need to visualize a huge dataset quickly without losing quality? No problem.
WebGL: the basics
Based on the OpenGL standard for embedded accelerated 3D graphics, WebGL is a cross-platform rendering component for superior browser-based graphics visualization. It’s also at the core of our KeyLines and ReGraph graph visualization toolkits.
There’s support for WebGL in all modern browsers, but you get virtually nothing out of the box. Everything you draw must be built from scratch, which is a good thing if you want drawing freedom: you have complete control over everything on the screen.
But the key reason for using WebGL is performance. To understand how it provides the impressive rendering speed and quality in our toolkits, we need to know what’s going on under the hood.
Delivering faster performance
There are two key ways to improve performance in an application:
- Make it work smarter by optimizing the code design, for example, caching data so subsequent requests are served faster.
- Make it work harder by fully exploiting the resources available, for example, using multithreading to execute requests concurrently.
In our graph visualization toolkits, WebGL lets developers do both. It does so by offloading much of the heavy lifting to the device’s graphics processing unit (GPU).
GPU and parallel processing
While the core processing unit (CPU) in a device performs a huge variety of operations, the GPU focuses on one purpose: displaying graphics at incredible speed. It features a specialist microprocessor designed to repeat simple operations multiple times. With many processing cores working simultaneously to produce exceptional power (known as parallel processing), the GPU can perform millions of WebGL calculations at once.
Parallel processing gives great potential for scaling: the more resource that’s available, the greater the capacity for performance improvements. We’ve put significant effort into making efficiencies that mean our toolkits deliver blistering rendering speeds for even the most complex graphics.
Let’s see how much faster we’ve made our WebGL implementation.
Measuring performance
Every movie, video, and animation is made up of many individual pages or frames. In general, higher frame rates make the animation smoother and the image details sharper.
By measuring how many frames per second our WebGL engine can display, we get a reliable performance metric.
Plenty of open source alternatives to our toolkits use WebGL, and they can adequately visualize thousands of nodes and links and achieve reasonable frame rates. What’s different with our technology is the level of fidelity and complexity. We’ve spent years making our WebGL renderer work harder and smarter. As a result, our frame rates are 15x faster than they were three years ago.
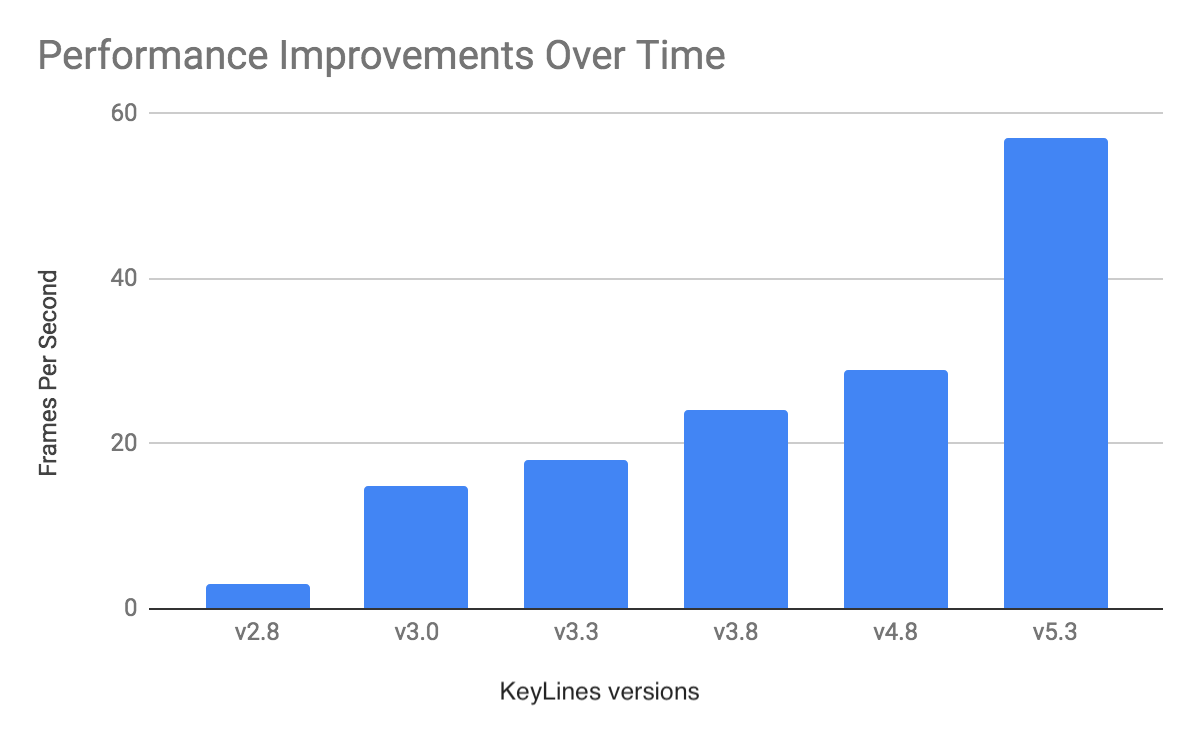
Frame rates on the same machine running the same data on different KeyLines versions
This is great news, especially when you’re trying to deliver the best user experience.
The UX implications
How does superior performance directly affect UX?
UX design focuses on understanding and delivering what your users want. The goal is to make them feel good about working with your graph visualization application.
Busy analysts need to find insight in huge datasets quickly. To see precise detail in motion – think animations or automatic layouts featuring thousands of items – they expect fast responses and smooth transitions without loss of clarity. Fail at one or all of these and you’ve frustrated them. Keep failing and you might lose their custom.
But provide a smooth, intuitive and enjoyable experience that exceeds expectations, and your users will be happy. They’ll look forward to using your application, knowing it’ll help them uncover threats without slowing them down.
A final word about HTML5 Canvas
We do support HTML5 Canvas too.
This popular, general-purpose API mainly concentrates on 2D graphics. It’s supported by a wide range of legacy browsers, is easy to use and comes with many features out of the box.
But while it’s a decent all-rounder, it isn’t as flexible and doesn’t perform as well as WebGL. If you want the best frame rates our toolkits can offer, it’s WebGL you need.
Ready for your application to start performing?
We’ve significantly improved our WebGL rendering performance lately. Why? So that every interaction your users have with their visualized data is fast, enjoyable and of the highest quality.
If you want to experience how well our toolkits perform, request a free trial or get in touch.
Share:
