Picture this: your dev team spends time and effort creating a quality graph visualization application for your users. It integrates seamlessly with your chosen graph database. It’s intuitively designed and fun to use. It displays beautifully stylized charts. Perfect, right?
Not quite.
They’re all important features, but if you build an app with a toolkit that doesn’t prioritize advanced performance, your users may find your product slow and frustrating.
Analysts need to load huge datasets fast, navigate fully-responsive charts and customize items without time lags. Fail to deliver that and your app misses its potential.
In this post, we focus on performance rates in ReGraph, our graph visualization toolkit for React developers. We take a closer look at the benchmarks that prove how powerful your apps could be.
A quick note about WebGL & measuring FPS
Our graph visualization toolkits are powered by the Web Graphics Library (WebGL) to guarantee superior performance rates. We’ve written in detail about the WebGL rendering component before. In short, it makes apps built using KeyLines and ReGraph work smarter and harder by letting the graphics processing unit (GPU) take the strain. As a result, your users can visualize bigger and more complicated datasets.
We measure performance by counting the number of individual frames per second (FPS) our WebGL engine displays. High frame rates mean smooth transitions and sharp images – exactly what your users expect.
To save having to create your own performance test frameworks, we’ve included a showcase demo on the ReGraph SDK site. Let’s see how it measures up.
Tracking chart item loading & layout metrics
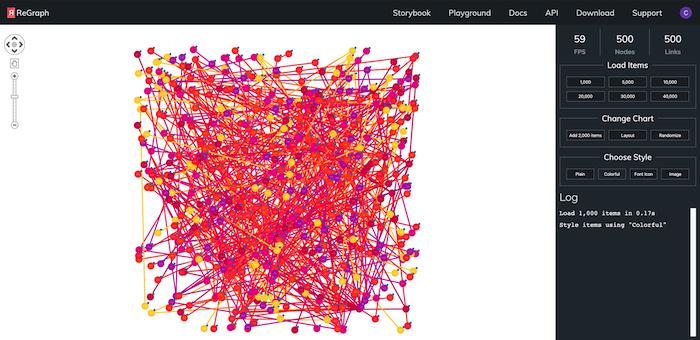
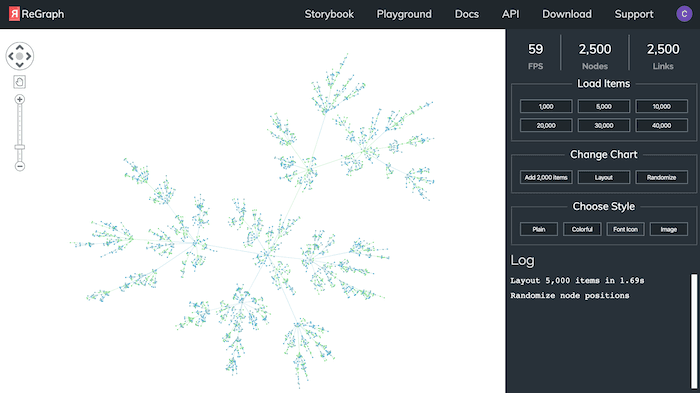
We start (relatively) small by loading 1,000 items. Let’s apply colorful styling so they stand out more. At 59 FPS the chart is drawn in an instant.
Loading 20x as many items isn’t a problem for ReGraph. The useful log confirms that nodes and links are added in less than two seconds.
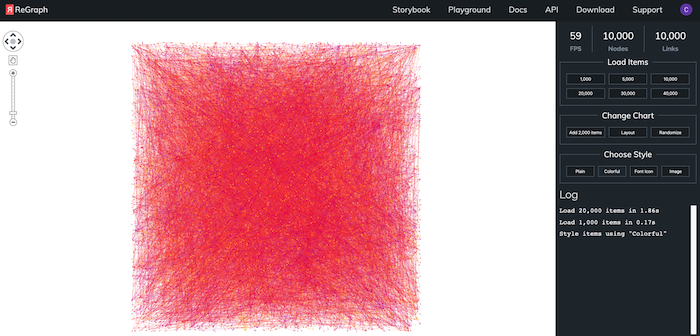
So far we’ve ignored the chart contents, each featuring a jumbled mass of overlapping connections. They’re great for gathering performance metrics, but neither of these examples is of practical use until we apply a layout.
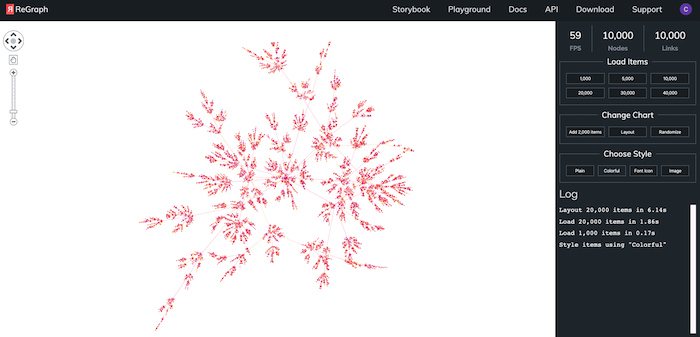
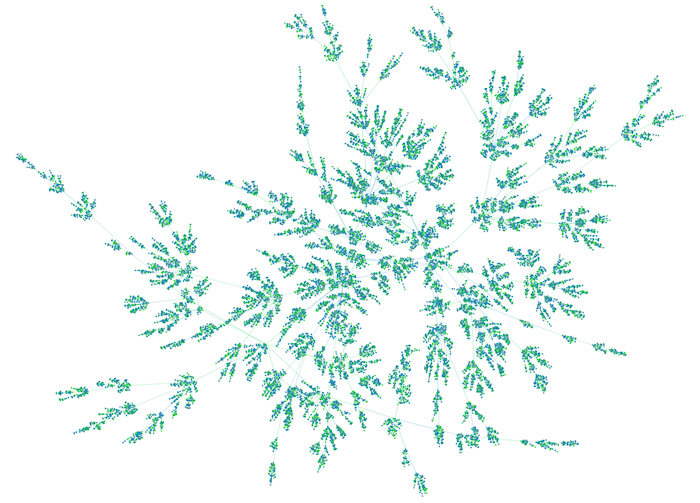
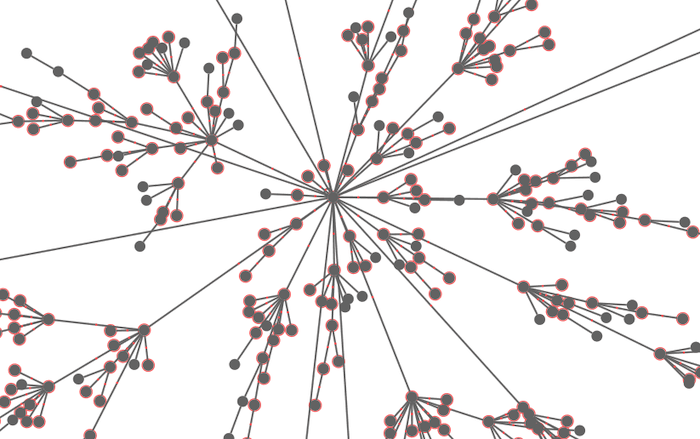
After a smooth transition, we see the overall shape of the data. It forms branches of connections spread out to make them more distinct. Again, the FPS and log time are impressive.
Expanding graphs without compromising speed
The smart approach is to design an app that matches the way analysts operate. Sometimes they prefer to start small and focus on key items of interest before widening their investigation to include associated connections.
We can test this scenario easily by expanding relevant data into the chart from the backend. No need to visualize everything upfront: ReGraph’s superior performance extends the dataset by 2,000 items at speed.
Once extra items are added, ReGraph applies the organic layout automatically to bring out the data’s underlying structures.
Benchmarking animations the easy way
Our ReGraph performance demo makes your tester’s life easier too. It supports a randomize option to return the chart to its original rectangular mass of items between layouts. That way, it’s easy to capture how fast ReGraph animates the layout for each of the six chart item options ranging up to 40,000 nodes and links.
Customize charts without impacting on performance
You can fully customize your ReGraph visualization component to suit your particular use case. The styling options we’ve applied here happen instantaneously, even on massive charts.
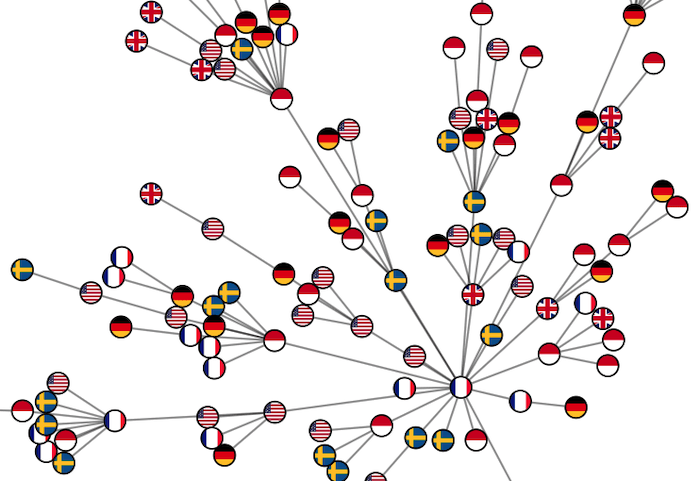
When you design the right visual model, analysts can choose the colors, font icons, glyphs and images that best match their scenario without compromising on performance. In this way, they can turn generic chart items into real-world representations, helping them spot patterns and outliers more easily.
A final word on best practice
It’s tempting to load the chart with every item in your dataset. Just because you can, it doesn’t mean you should.
Our toolkits can handle big data, but visualizing masses of connections won’t necessarily help analysts find insight. For practical tips on aggregating and filtering large datasets into something manageable and useful, see Five steps to tackle big graph data visualization.
Time to start performing
We’ve always prioritized performance in our toolkit technology. ReGraph’s powerful rendering gives your analysts the quality and speed they expect from a superior graph visualization tool.
Don’t just take our word for it. To try this performance demo yourself, request a free ReGraph trial and visit our ReGraph SDK site to view showcases and documentation.
Share: