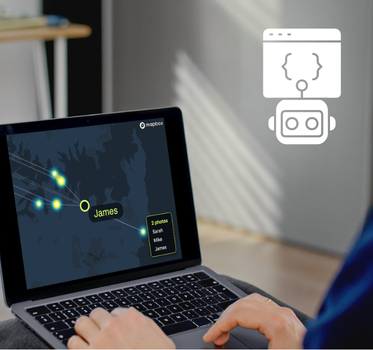
Visualizing graphs without a graph database
Many people think that visualizing graphs means you need a graph database like Neo4j. That’s not necessarily true. In this session, graph visualization expert – Christian Miles – explains how to get started withgraph visualization using any database, API, or even just a CSV file.
Visualizing graphs from non-connected data sources

Explore any file format, search index or database you use. They almost always have at least one thing in common: they’re sources of connected data. Each features connections or relationships between nodes or entities. In graph databases, these connections are as important as the entities themselves, so graph visualization is the natural next step to exploring them in more detail.
When you’re working with data sources like CSV files or SQL Server databases, those connections aren’t as explicit. Before creating graph visualizations from these sources, connections have to be derived.
In this video session, Christian Miles provides a practical guide to connecting the non-connected. He runs through a list of factors you’ll need to consider before creating graph visualizations from any source, such as scalability, support and standardization. He demonstrates how to convert data that at first glance appears unsuited to graph visualization into a node/link format. You’ll learn how to include properties, and in a few simple steps, start visualizing graphs.