A NoSQL Key Value Store and Column Store form the most basic NoSQL data models. Their speed, simplicity and ability to distribute across multiple hosts has made them popular in the world of enterprise data – and therefore they’re a common choice for graph visualization.
What is a NoSQL Key Value Store?
A NoSQL Key Value NoSQL database stores data as a set of Keys and Values, also known as an associative array, organized into rows. For example, a database of car insurance policies might look like this:
| Value_ Policy_ Address | Holder_Name | Value_ Vehicle_ ID | Value_ Vehicle_ Model | Value_ Vehicle_ Year | |
| Policy_AB 123123 | 123 Road Street | Joe Smith | 19[…]213 | Coupe | 2012 |
| Policy_ZN 987987 | 42 Mill Crescent | Chris Bloggs | 14[…]133 | Estate | 2007 |
| Policy_JP 456456 | 12 Sample Street | Michael Richards | 19[…]313 | Coupe | 2012 |
Examples of a NoSQL Key Value store include: Redis and DynamoBD.
What is a NoSQL Column Store?
A column store uses a similarly flat structure, but with keys stored in columns rather than rows:
| Policy_ AB123123 | Policy_ ZN 987987 | Policy_ JP 456456 | |
| Value_ Policy_ Address | 123 Road Street | 42 Mill Crescent | 12 Sample Street |
| Value_ Holder_ Name | Joe Smith | Chris Bloggs | Michael Richards |
| Value_ Vehicle_ ID | 19[…]213 | 14[…]133 | 19[…]313 |
| Value_Vehicle_Model | Coupe | Estate | Coupe |
| Value_Vehicle_Year | 2012 | 2007 | 2012 |
Examples of NoSQL Column stores include: Hadoop, HBase and DynamoDB.
Converting NoSQL tables into a network
When visualizing a NoSQL Key Value store or Column data as a network, we need to convert the data into a node-link model.
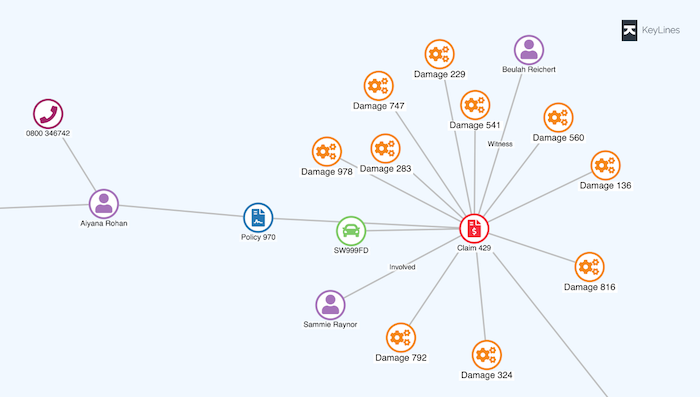
A single table can be mapped as many nodes or a single node with many properties. For example, an insurance fraud analyst might want to identify individuals making an unusual volume of claims, in which case names, addresses, policies, and claims could all be modeled as nodes, with remaining data entities included as properties:
Learn more about modeling graph data
NoSQL Visualization infrastructure
We can visualize NoSQL data in either KeyLines or ReGraph using the following architecture:
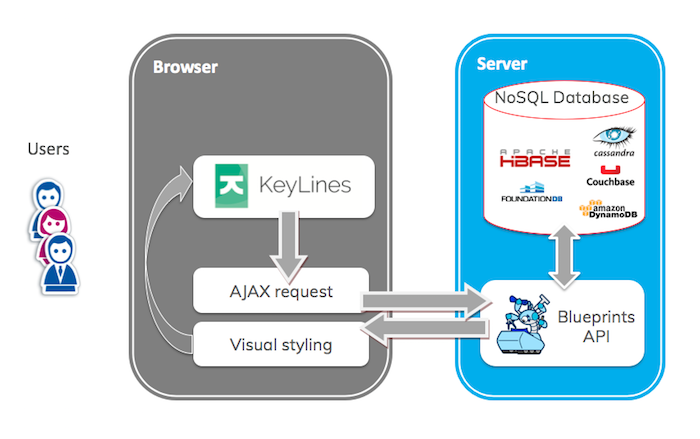
With this setup, AJAX requests are raised when a user interacts with their graph visualization chart. This calls for data from the database, either via an API like Blueprints, or with your own choice of API.
Once the data is retrieved, it is parsed into JSON and merged or loaded into the visualization chart.
Learn more
To learn more about graph visualization and how to visualize your complex connected data, download our ultimate guide to graph visualization
How to visualize your graph data
At Cambridge Intelligence, we help developers build graph visualization tools that are 100% customized to their users, their data and the questions they need to answer.
Graph visualization for JavaScript developers
Code how you like. Add graph visualization to your applications that work anywhere, as part of any stack.
Graph visualization for React developers
With ReGraph’s simple data-driven API, it’s quick and easy to add graph visualizations to your React applications.