MapWeave features
Explore the functionality of our geospatial visualization SDK
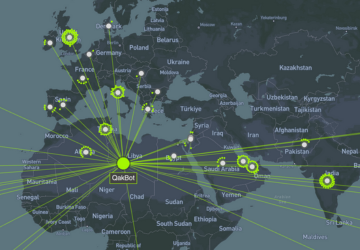
Intuitive layouts
Our unique, geospatially-aware graph layout handles any combination of free and fixed nodes. It even adapts with your zoom level to reveal local detail or global insight.
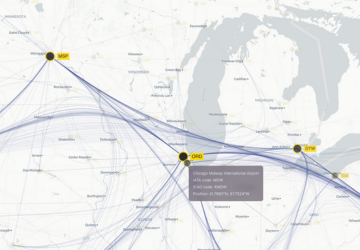
Adaptive rendering
MapWeave intelligently sizes, fades, positions and labels every item based on zoom level, keeping users focused on the most important information without the clutter.
Scalability
Our GPU-powered rendering keeps interactions fast, even when working with millions of time-stamped observations.
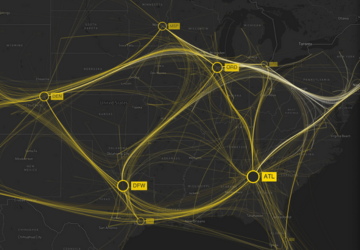
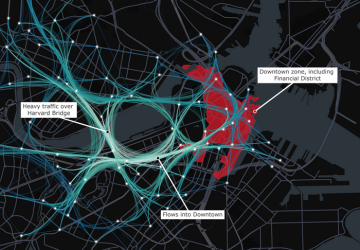
Flows and bundling
MapWeave’s edge bundling algorithm simplifies tangled geospatial networks into clear, streamlined visualizations where flows, trends and insights are easy to spot.
Layers
Mix and match any combination of MapWeave’s powerful data layers to create compelling visualizations of networks, flows, regions, annotations and more.
Basemap flexibility
MapWeave’s open architecture is compatible with a huge range of map tiles and basemap libraries. Overlay satellite imagery, import 3D assets, use 3rd party services or host an offline tile server – the choice is yours.
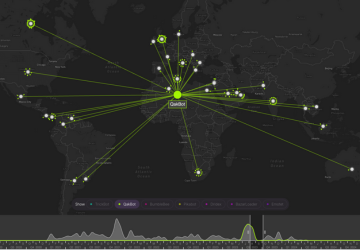
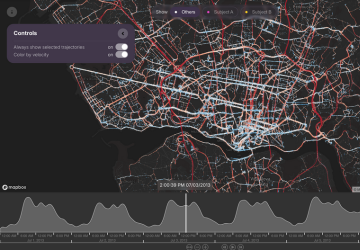
Fast time filtering
Take advantage of high-performance GPU-based filtering to add interactive timelines to your MapWeave applications, letting users explore how events and movements unfold over time.
![]()
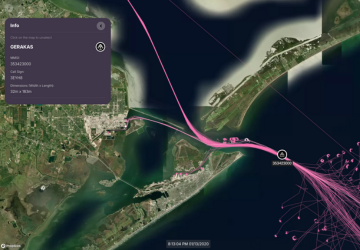
Trackers & trajectories
Convert raw observations data into meaningful narratives using trajectories and moving trackers. Great for pattern-of-life analysis and situational awareness.
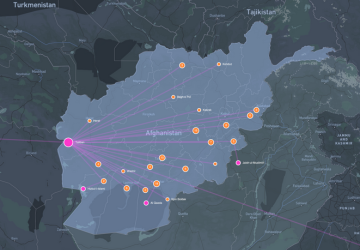
GeoJSON support
MapWeave’s GeoJSON layer unlocks essential and impactful analyst interactions like geofencing, or highlighting significant regions and boundaries.


