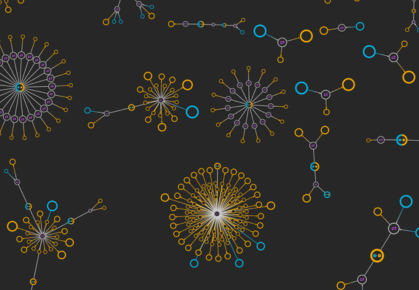
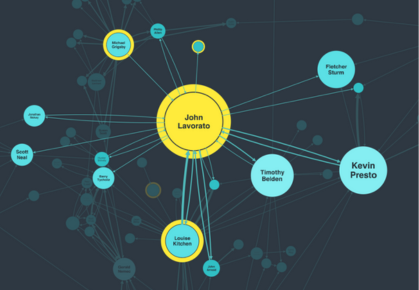
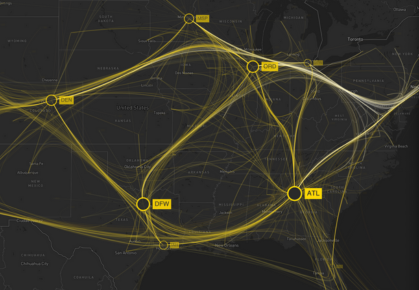
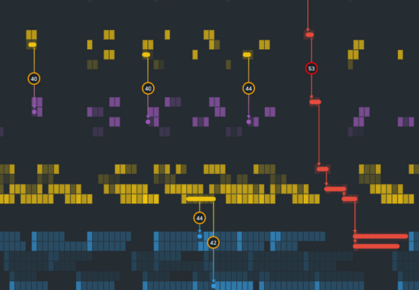
October updates: the new-look time bar

Data connections almost always develop over time. That’s why the time bar is one of the most popular features of our graph visualization technology. It’s also why we’ve spent recent months working hard on brand new time bar features we think you’re going to love.

Learn more about visualizing dynamic networks with the time bar

New: stacked histogram bars

The time bar’s histogram helps analysts understand changes in the volume of activity over time. With support for stacked bars, they can now see a breakdown of the types of activity too.

Stacked histogram bars are fully customizable, like nearly everything else in the time bar. By color-coding different activities, it’s easier to spot and compare subsets of data at a glance.

Use stacked bars in your time bar’s histogram to identify how different types of activity evolve

New: time bar area plots

When we’re focussing on peaks of activity in a histogram, our brains automatically draw an imaginary line along the top of each bar. To save analysts from this cognitive effort, they can now plot areas instead of histogram bars on the time bar.

Zooming in and out of area plots – the latest approach to time-based data visualization

This new way to present time-based events gives a more fluid display of what’s happening in your data. The smooth line is ideal for revealing patterns and trends.

Further toolkit modernization

Our August toolkit update featured more modern code examples across the KeyLines SDK and improvements to TypeScript definitions.

This time we’ve modernized the code in every database integration demo and updated each database integration guide too. Getting started with visualizing your favorite graph database – Neo4j, DataStax, Amazon Neptune, etc – has never been easier.

Time to try our toolkits?

There are so many powerful features in KeyLines and ReGraph. To access them, just request a free trial or contact us to talk through your plans for a game-changing graph visualization web application.

How can we help you?

Request trial

Ready to start?

Request a free trial

Learn more

Want to learn more?

Read our white papers

“case

Looking for success stories?

Browse our case studies

Registered in England and Wales with Company Number 07625370 | VAT Number 113 1740 61
6-8 Hills Road, Cambridge, CB2 1JP. All material © Cambridge Intelligence 2024.
Read our Privacy Policy.