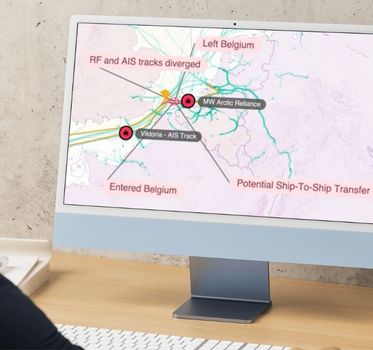
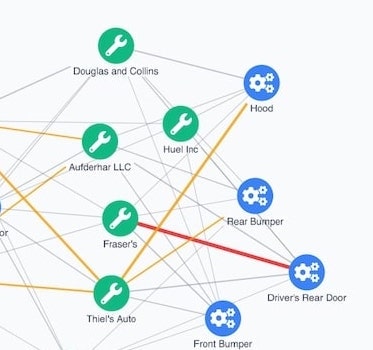
In this webinar, graph visualization expert Corey Lanum looks at some of the advanced graph technologies you can use to analyze cyber attacks and protect your assets.
He explains how graph and timeline visualization is an incredibly powerful tool for cyber threat analysis, and looks at:
- techniques for working with huge data sets
- how timeline visualization opens up an investigation
- bringing the story to life with animation


