KeyLines and ReGraph are database agnostic network visualization tools. This means they are compatible with any datastore you want to use, and NoSQL is a popular choice.
What is NoSQL?
NoSQL (sometimes also called ‘Not Only SQL’) is a collection of database categories based on non-relational models.
These systems can offer excellent scalability, performance and flexibility in some circumstances, as well as simpler maintenance and cheaper hardware requirements. That’s why they’re popular options for enterprise-level ‘big data’ and network visualization.
Converting NoSQL data into network visualizations
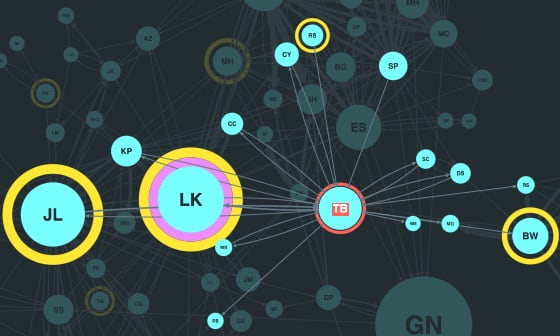
Graph stores
This is by far the easiest conversion. Direct mapping into our products is simple, as the data is already in node-relationship format. Graph database nodes become visualization nodes, and edges become visualization links.
For example, Neo4j relationships like “OWNS_VEHICLE” or “FILED_CLAIM” translate directly into visual connections.
Key-Value stores and Column-Family stores
Flat key-value pairs lack inherent relationships. Column-Family stores are similar to key-value stores, but with richer data. A NoSQL Key Value Store database of car insurance policies might look like this:
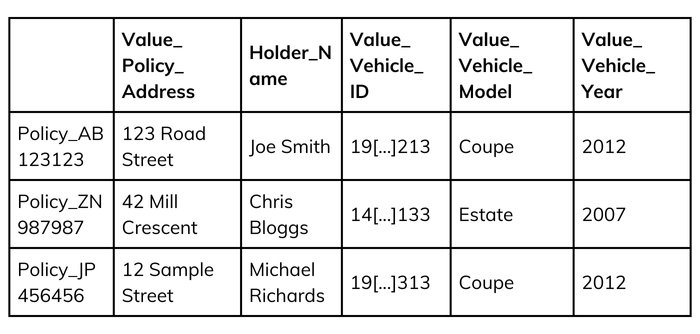
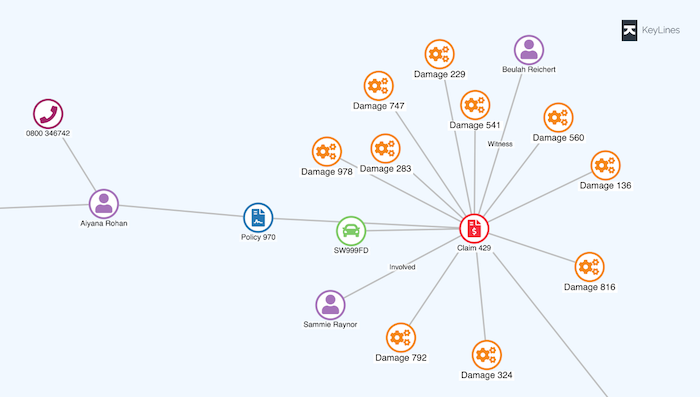
You can create relationships for both types of store by identifying shared values across different keys.
For example, an insurance fraud analyst might want to identify individuals making an unusual volume of claims, in which case names, addresses, policies, and claims could all be modeled as nodes, with remaining data entities included as properties:
Document stores
The challenge here is that documents are self-contained with nested structures. Here’s how that might look. The solution is to extract key fields from documents to create nodes, and identify relationships through shared field values or references.
Each document can become a central node with properties, or nested data from the document can be restructured into multiple related nodes.
{
"policyNumber": "AB 123 123",
"policyAddress": "123 Road Street",
"holderName": "Joe Smith",
"vehicleID": "19UYA1234L000213",
"vehicleModel": "Coupe",
"vehicleYear": "2012"
}
{
"policyNumber": "ZN 987987",
"policyAddress": "42 Mill Crescent",
"holderName": "Chris Bloggs",
"vehicleID": "14PLU1234L120213",
"vehicleModel": "Estate",
"vehicleYear": "2007"
}
{
"policyNumber": "JP 456456",
"policyAddress": "12 Sample Street",
"holderName": "Michael Richards",
"vehicleID": "19UYA1234L000213",
"vehicleModel": "Coupe",
"vehicleYear": "2012"
}
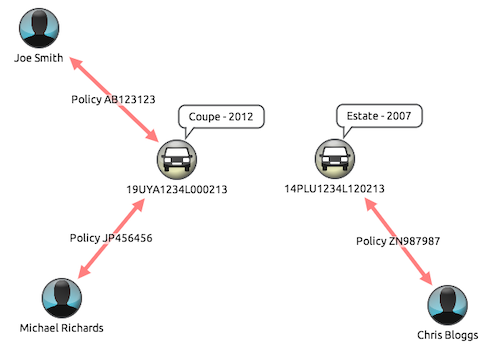
In a car insurance fraud investigation, you might want to look for vehicles with more than one insurance policy.
In this case, you’d map the policy holders and VIN numbers to nodes, and the policy numbers to links, with the remaining data entities included as properties:
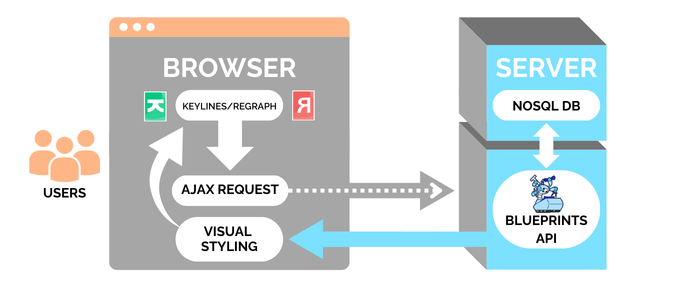
NoSQL visualization infrastructure
With this setup, AJAX requests are raised when a user interacts with their graph visualization chart.
This calls for data from the database, either via an API like Blueprints, or with your own choice of API. Once the data is retrieved, it’s parsed from JSON and merged or loaded into the visualization chart.
Start visualizing your graph data
At Cambridge Intelligence, we help developers build graph visualization tools that are 100% customized to their users, their data and the questions they need to answer.
Graph visualization for JavaScript developers
Code how you like. Add graph visualization to your applications that works anywhere, as part of any stack.
Graph visualization for React developers
With ReGraph’s simple data-driven API, it’s quick and easy to add graph visualizations to your React applications.
