KronoGraph Features
Explore our timeline visualization SDK’s functionality
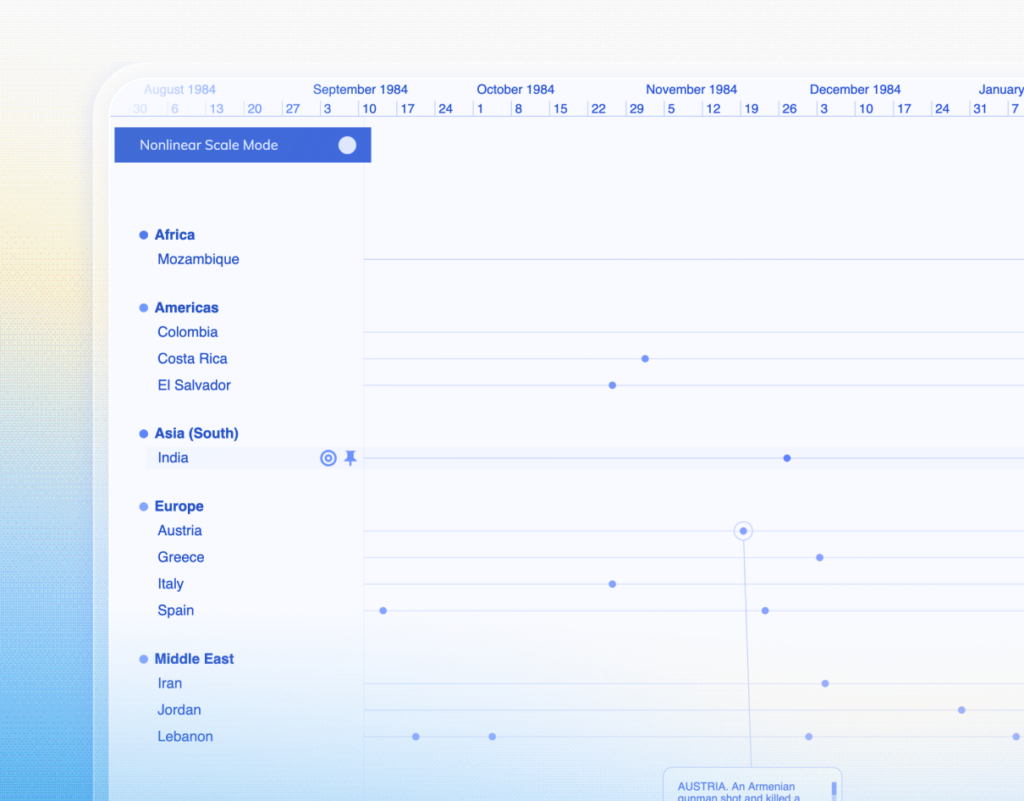
Timeline exploration & analysis
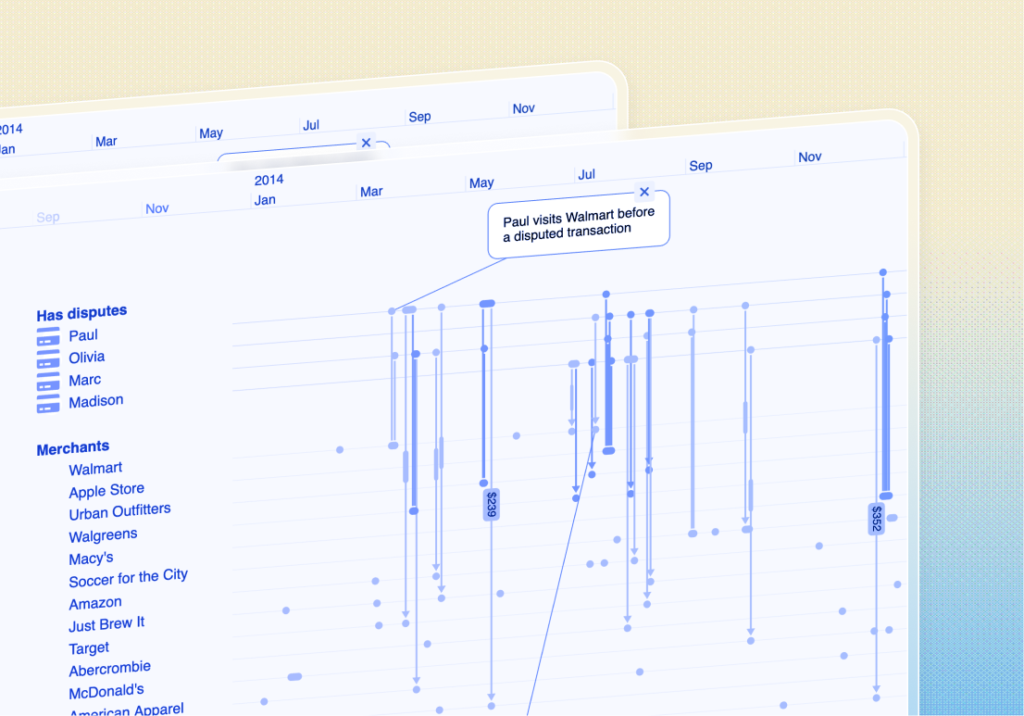
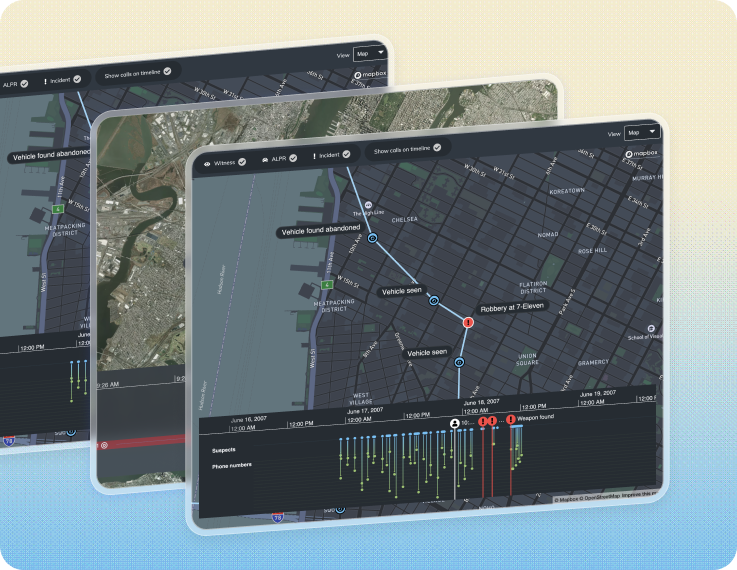
KronoGraph lets analysts explore time-based data from multiple angles — from reconstructing the sequence of events leading up to an incident, to spotting unusual patterns in communications, movements, or behaviors over time. Whether you’re tracing supply chains, identifying insider trading, or analyzing pattern-of-life data, interactive timelines help reveal what happened, when, and why.
Explore connected events to understand causality and context
Identify anomalies and behavioral patterns over weeks, or longer periods.
Add annotations and labels to build clear analytical narratives.
Apply custom styling to highlight entities, events, and relationships
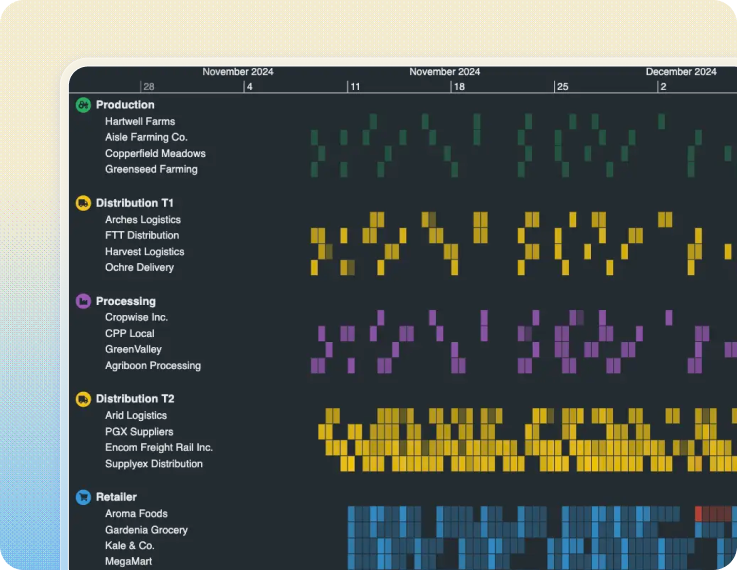
Performance and scale
Understanding temporal data often involves large event datasets, from large volumes of email activity to high-volume alert data generated by cloud systems. KronoGraph is designed to stay fast and responsive as datasets grow and interactions become more complex.
- Navigate large datasets of events with smooth zooming and panning
- Move between high-level summaries and individual events
- Maintain performance during interaction-heavy analysis
- Visualize high-volume or continuously updating event data without sacrificing clarity
Ready to get started with KronoGraph?
Developer experience
Everything you need to build quickly and confidently, with clear documentation, integrated tooling, and direct support when it’s needed.
- Easy-to-follow documentation and dozens of live demos
- A code playground to experiment, prototype, and share ideas
- Frequent releases, stable Long-Term Availability versions, and a strict semantic versioning policy
- Works with all front-end frameworks and databases
- Direct access to expert developer support.
- Model Context Protocol (MCP) support for more accurate, context-aware development with AI code assistants
Security and deployment
Deploy KronoGraph into enterprise environments without changing your tech stack. The SDK runs entirely in your infrastructure, giving you full control over data, security, and performance.
- A front-end SDK you host wherever you choose; fully agnostic to your back-end and databases
- Your data stays inside your trusted network
- No specialist servers to provision and no compulsory external services
- Works with your existing build and deployment pipelines
- Supports SaaS, on-premise, and air-gapped deployments
- Designed with minimal external dependencies
- Developed and maintained under ISO-certified security and quality management processes
Flexible licensing
KronoGraph can be used independently, or combined with other Cambridge Intelligence SDKs as your requirements evolve.
| SDK | Primary visualization | Can be used standalone | Can be combined with other SDKs | Typical use |
|---|---|---|---|---|
| KeyLines | Graph | Network and relationship analysis | ||
| ReGraph | Graph (React) | Graph visualization in React applications | ||
| KronoGraph | Timeline | Interactive timeline analysis of event data | ||
| MapWeave | Map | Geospatial network visualization and movement analysis |
Ready to get started with KronoGraph?