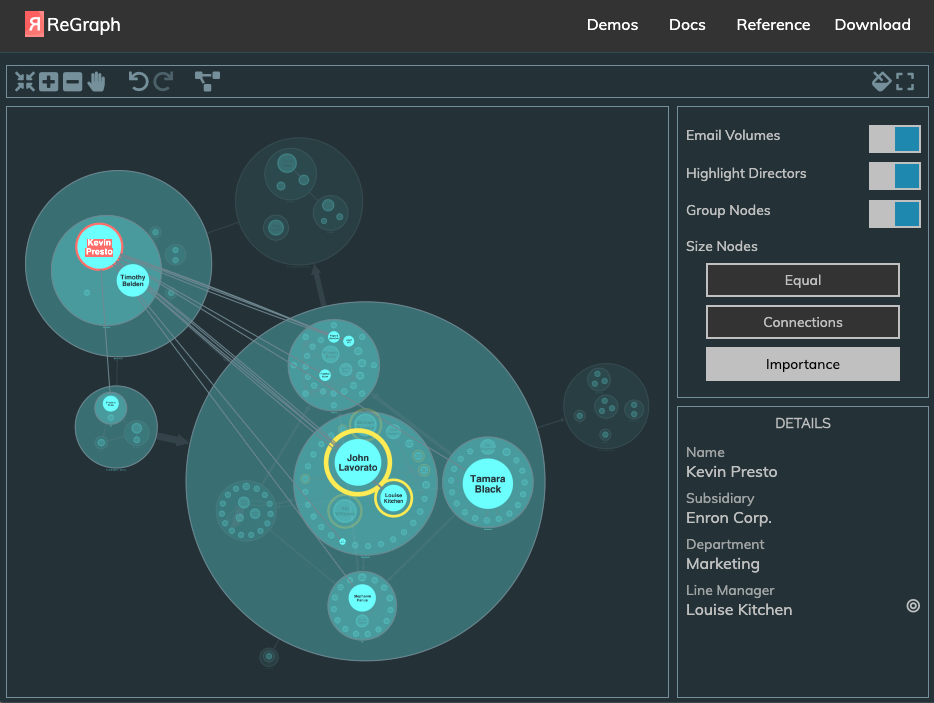
After a successful Early Access Program (EAP), we’re proud to release v1.0 of ReGraph, our graph data visualization toolkit for React developers.
ReGraph lets React developers add powerful, interactive graph data visualization to their applications quickly and easily. It’s compatible with all modern browsers, operating systems and platforms, and exploits robust WebGL rendering technology to deliver blistering performance.
With advanced graph analysis and visualization features, the ReGraph SDK makes it easy to find insight in your complex graph data. As a commercially-licensed product, it also comes with dedicated support from our expert React developers.

During the EAP, we worked with developers in many sectors including cybersecurity, intelligence, and data center management. They were the first to integrate ReGraph with their React-based applications, use the data-driven API, and try our fully-interactive demos and developer documentation.
The EAP was a great success, and the ReGraph toolkit is now ready to ship to customers.
Joe Parry, Founder and CEO of Cambridge Intelligence said:
I’d like to thank everyone who took part in the ReGraph EAP – the feedback we received was fantastic. So many application providers were keen to try our React toolkit and make sense of their connected data. React developers want a tool that’s designed to feel familiar right away, is easy and enjoyable to use, and speeds up development. We’re delighted they’re choosing ReGraph to build the powerful graph visualizations their users need.
To see it for yourself, request a free trial or ReGraph or re-watch our ReGraph webinar. In it, we demonstrate how ReGraph works, how easy it is to get started, and why it’s the best graph visualization option for React projects.


