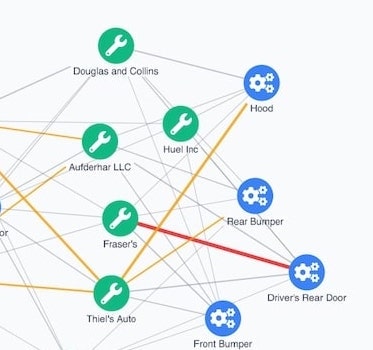
The pharmaceutical data challenge
Science is the process of generating knowledge from data and information; so harnessing data visualization is a natural step for pharmaceutical scientists.
It’s good timing too. With tougher regulation and increased competition, good data analysis is more important than ever.
Pharma data visualization cuts through noisy data to reveal the connections and patterns you need to see.
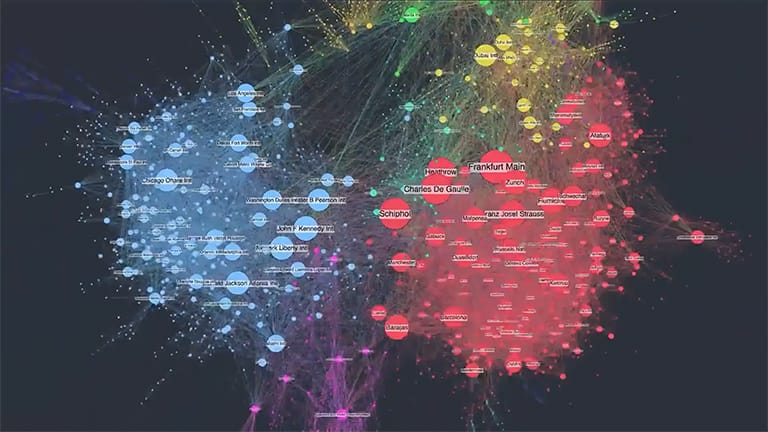
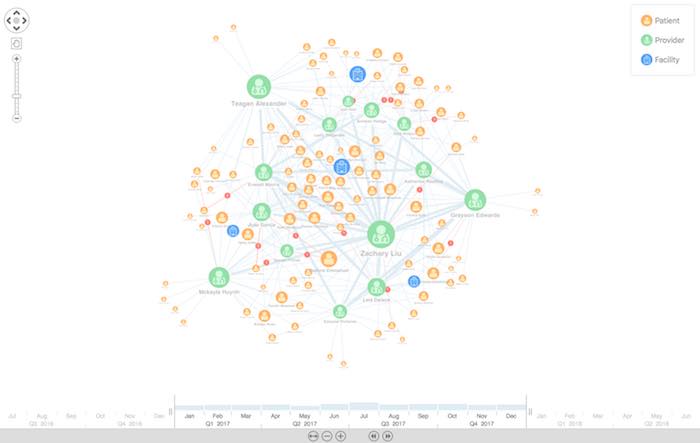
Pharma data visualization, especially network visualization and timeline visualization, helps clinicians and analysts to join the dots in pharmaceutical data.
Let’s see how it helps them make better decisions more quickly.
Drug discovery
Bringing a new drug to market is expensive and laborious.
Researchers need to understand connections, between chemical and effect, agent and disease, or between a drug and a market opportunity. Once connections have been identified, companies can find a way to exploit them.
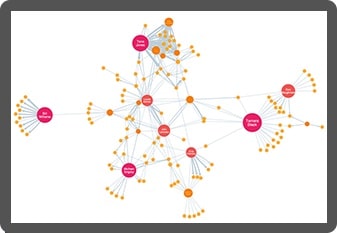
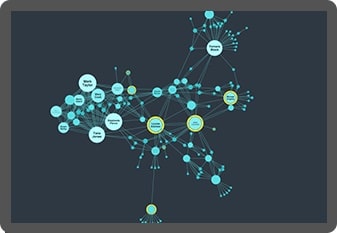
Network visualization makes it faster and easier to identify connections, revealing patterns, correlations, gaps and anomalies, and making research generally more cost efficient.
Learn more in our white papers
We’ve helped some of the world’s leading pharmaceutical companies visualize their data.
Competitor analysis and market landscaping
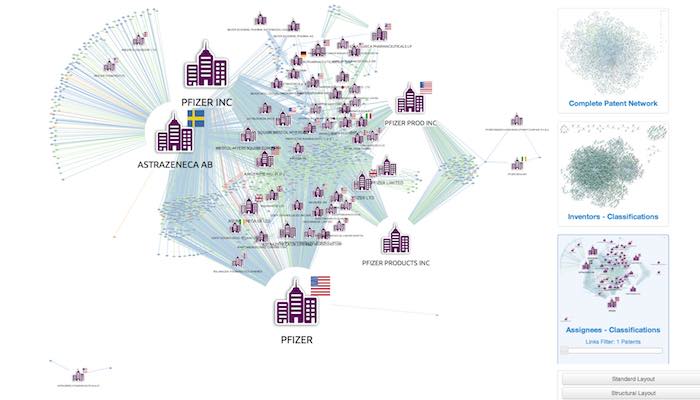
The pharmaceutical industry is competitive, with thousands of patents registered each year. Understanding competitors, their intellectual property and product pipeline is essential for making the right product decisions.
Pharma data visualization untangles connections between patents, classifications, assignees and inventors, giving a clear overview of the intellectual property landscape. This can be especially useful for merger and acquisition activity.
Learn more about pharma data visualization focusing on healthcare.
Enterprise knowledge graphs
Pharmaceuticals is a data-heavy industry.
Teams, often dispersed across multiple groups in different sites across several countries, require fast and easy access to the right data at the right time. This requires knowledge graphs – powerful integrated data management, search and analysis systems, unhindered by data silos.
The ability to visualize the connection between research and results avoids effort duplication, identify gaps in understanding and generally ensure better decisions.
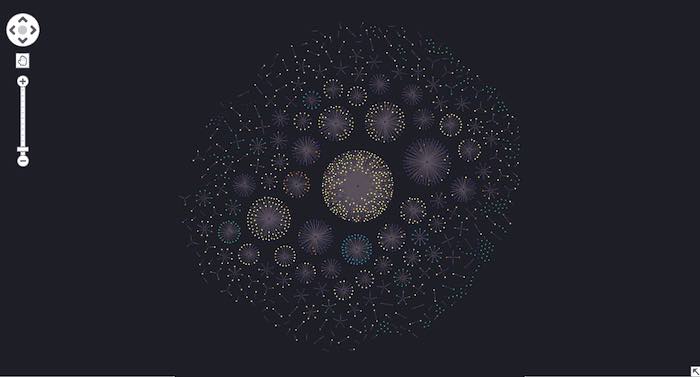
Custom pharma data visualization
We work with research and pharmaceutical businesses worldwide, helping them to make sense of big data.

See the full picture
Interact with data from across the organization in a single chart. Our products’ flexible approach means you can overcome data silos and gain insight into information from multiple sources, giving you a clearer, more complete picture.

Visualization that scales
Our toolkits support data analysis at scale. Whether that means you’ve got a large and distributed team, or huge volumes of data to analyze, we’ve designed our products to scale-up to any size organization and operation.

Get answers faster
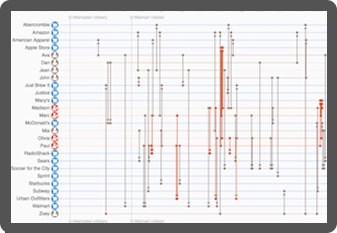
Discover more intuitive ways to understand your pharmaceutical data. Timeline and graph analysis tools reveal insight more effectively than other automated or manual processes, leading to richer insight, faster and better decisions.

Custom tools that work for you
Visualization tools, custom designed for your team and the data they need to understand, empower anyone to find insight in complex data. The result: insightful and straightforward tools that people want to use.
