Start a KeyLines trial
To follow this tutorial, you’ll need a KeyLines evaluation account.
Titan is a scalable, open-source distributed graph database. Using distributed multi-machine clusters, users can store and query hundreds of billions of vertices and edges. Its power and easy integration means it’s a popular back-end option for many KeyLines developers.
In this tutorial, we walk through the steps of connecting KeyLines to your Titan 1.0 database.
Visualization architecture
KeyLines is our graph visualization toolkit for JavaScript applications. It’s 100% database agnostic, but is a particular good fit for graph database visualization.
KeyLines is a JavaScript file that’s deployed to a web server. A chart element (powered by either HTML5 Canvas or WebGL) is then embedded into a web page for the user to access. As the user interacts with the chart, events – like click, double-click, drag – are raised. You can then customize the response to these events, creating a custom user experience.The architecture is clean, secure and fits any IT environment:
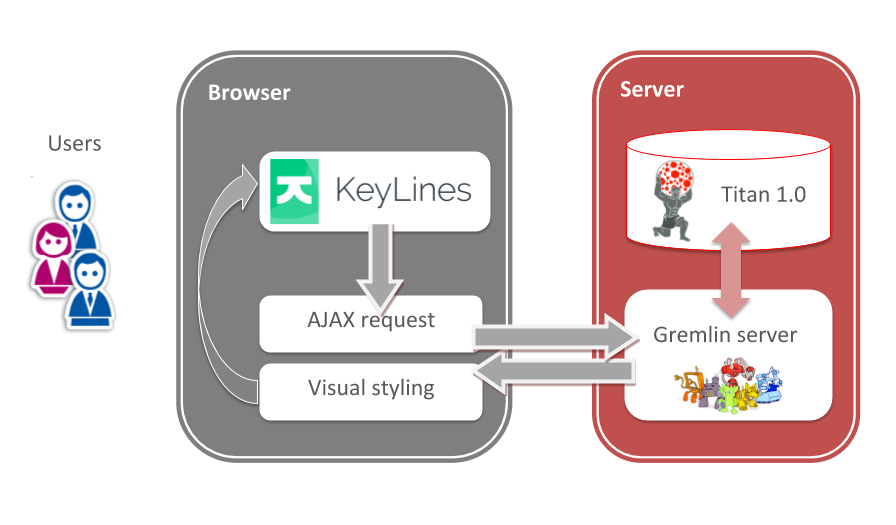
- Users interact with their KeyLines chart using their web browser.
- If an interaction, e.g. right-click, hover, etc., requires new data to be added to the chart, a database query is raised. This is generated by KeyLines in the form of an AJAX request.
- The AJAX request is passed to Titan, via the Gremlin Server.
- Titan receives the request and sends the required graph data back to the server, which produces a JSON object for KeyLines.
- KeyLines renders the data in the browser, using the HTML5 Canvas or WebGL element.
WebSockets v HTTP Calls
TinkerPop3 provides two means of communication between your KeyLines application and Titan – WebSockets or an HTTP REST endpoint.
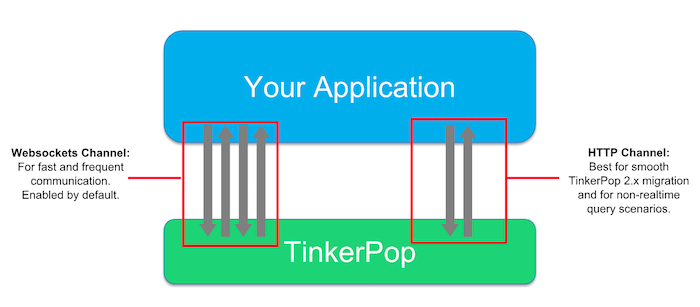
- WebSockets is the default option, and works best in scenarios requiring fast and frequent data transfer – for example, real-time data visualization or data streaming.
- The HTTP channel is your best option if you are migrating from TinkerPop 2.X.
In the instructions below, Step 4 has been split into two depending on which option works best for your project.
Step 1: Configuration
Thanks to TinkerPop3, configuring your Titan instance is relatively simple, following the very comprehensive documentation provided by the Titan team:
You can download the required Titan files here, too.
In this tutorial, we’ll explain how to work with the ‘Titan for Hadoop 1’ version. It includes the Gremlin Server and Gremlin Console, so no additional downloads are required.
Titan and Hadoop should be configured on the same Java Virtual Machine (JVM), this way the two are able to communicate with each other via process calls. If you need a distributed setup with Titan and Hadoop on separate servers and communication occurring over the network, instructions to set that up can be found in the documentation.
Step 2: Load your graph
GraphSON is TinkerPop3’s file format for graph elements which we’re going to use as our data set. Note, the code will work with any supported format as well.
Our first step is to start Titan, with the following command:
$ cd titan-1.0.0-hadoop1 && ./bin/titan.sh start
This produces the following output:
Forking Cassandra...
Running `nodetool statusthrift`... OK (returned exit status 0 and printed string "running").
Forking Elasticsearch...
Connecting to Elasticsearch (127.0.0.1:9300).... OK (connected to 127.0.0.1:9300).
Forking Gremlin-Server...
Connecting to Gremlin-Server (127.0.0.1:8182)..... OK (connected to 127.0.0.1:8182).
Run gremlin.sh to connect.
Once Titan has started, start your Gremlin console and enter:
$ ./bin/gremlin.sh
This should open a Gremlin shell and show the following output:
         \,,,/
         (o o)
-----oOOo-(3)-oOOo-----
plugin activated: aurelius.titan
plugin activated: tinkerpop.server
plugin activated: tinkerpop.utilities
plugin activated: tinkerpop.hadoop
plugin activated: tinkerpop.tinkergraph
gremlin>
This will activate the required TinkerPop plugins. Next, we need to connect to the Gremlin graph server to load our dataset:
gremlin> :remote connect tinkerpop.server conf/remote.yaml
==>Connected - localhost/127.0.0.1:8182
You should now have a Titan database instance running, loaded with your dataset. You can test this using the following commands:
gremlin>  :>  graph.io(graphson()).readGraph('path/to/graph.json')
==> null
gremlin> :> g.E().count()
==> 9138
Step 3: Configure the Gremlin Server
Note: If you’re using the WebSockets configuration, jump straight to step 4. If you don’t need WebSockets, or if you’re migrating from an old version of Titan & Rexster, you’ll need to follow these steps to adjust the configuration:
Shutdown Titan:
$ ./bin/titan.sh stop
Edit the configuration file (use vim or any other editor you like):
$ vim ./conf/gremlin-server/gremlin-server.yaml
Change the channelizer value from WebSocketChannelizer to HttpChannellizer.
Save and exit.
Restart Titan:
$ ./bin/titan.sh start
Step 4: Set up a webpage with KeyLines
Once you have access to the KeyLines SDK and have configured Titan and the Gremlin Server, you can embed a KeyLines chart into your webpage to view the data.
The HTML code below does two things – first, it initializes a webpage with some basic dependencies, and second, it creates a KeyLines chart object:
<!DOCTYPE html>
<html>
<head>
  <!-- Load other libraries we want to use, e.g. jQuery -->
  <script src="jquery.js" type="text/javascript"></script>
</head>

<body>
  <!-- This is the HTML element that will be used to render the KeyLines component -->
  <div id="kl" style="width: 400px; height: 300px;"></div>

  <!-- This is the actual code to load KeyLines in the page -->
  <script type='module'>
  import KeyLines from './node_modules/keylines/esm/index.js';

  // This will store a reference to our KeyLines chart object
  var myChart;
  $(window).load(function() {
    // Load the component
    KeyLines.create('kl', chartReady);
  });

  function chartReady(err, chart) {
    // Store a reference to the KeyLines chart object
    myChart = chart;

    // Load data into the chart
    expandChart();
  }

  function expandChart() {
    // Stub function - to be filled out later
  }
</script>
</body>
</html>
Step 5: Call the Gremlin Server
Option A – WebSockets
If you’re using the default WebSockets configuration, you can call the Gremlin server using the following steps:
Download the Gremlin-JavaScript module and build the browser version of the library. If you’re using a tool like Browserify or Webpack, make sure you require the library in your app and skip the next step.
Include the gremlin.js file in your HTML page, inside the head element.
<script src=”js/gremlin.js” type=”text/javascript”>
Set up the Gremlin Server client on top of your app code, inside the $(window.load) callback:
var client = gremlin.createClient();
Now add a function to use the client object to query the database:
              function gremlinQuery(query, params) {
              return new Promise( function(resolve, reject) {
              client.execute(query, params, function(err, results) {
              if(err){
              return reject(err);
            }
            return resolve(results);
          });
        });
      }
And replace the expandChart function stub with:
      function expandChart(callback) {
      var queryString = 'g.V().hasLabel(accident).inE(involvedIn).outV().hasLabel(vehicle)';
      var queryArgs = { accident: 'accident', involvedIn: 'involved in', vehicle: 'vehicle' };

      gremlinQuery(queryString, queryArgs).then(function(items) {
      // Print the result
      console.log(items);

      // Create the KeyLines items from the returned items
      fromTitanToKeyLines(items, callback);
    });
  }
Option B – REST endpoint
If you’re using the REST endpoint, define the following function to call the Gremlin server:
  function gremlinQuery(query, params) {
  var queryObj = {
  gremlin: query,
  bindings: params
};
return $.post('http://localhost:8182', queryObj);
}
And replace the expandChart function stub with the following:
  function expandChart(callback) {
  var queryString = 'g.V().hasLabel(accident).inE(involvedIn).outV().hasLabel(vehicle)';
  var queryArgs = { accident: 'accident', involvedIn: 'involved in', vehicle: 'vehicle' };

  gremlinQuery(queryString, queryArgs).done(function(json) {
  // Print the result here
  console.log(json);

  // Create the KeyLines items from the json
  fromTitanToKeyLines(json.result.data, callback);
});
}
Step 6: Load the data into KeyLines
Next, you need to convert the Gremlin query result into KeyLines format, and load it into the chart. This fromTitanToKeyLines function will do the job:
  function fromTitanToKeyLines(items, callback) {
  var klItems = items.map(function(item) {
  if (item._type === 'vertex') {
  return createNode(item);
} else {
return createLink(item);
}
});

// now load it with a nice animation
chart.expand(klItems, { tidy: true, animate: true }, callback);
}
By this point, you should see a KeyLines chart pulling data from your Titan database.
Step 7: Customize your chart
The final part of the process is to customize your chart’s appearance, workflow and functionality.
KeyLines offers a huge range of different ways to customize your final application – far too many to outline here. Instead we recommend taking a detailed look through the KeyLines SDK documentation, especially the API reference and sample demos.
FREE: Start your KeyLines trial today
Visualize your data! Request full access to our KeyLines SDK, demos and live-coding playground.